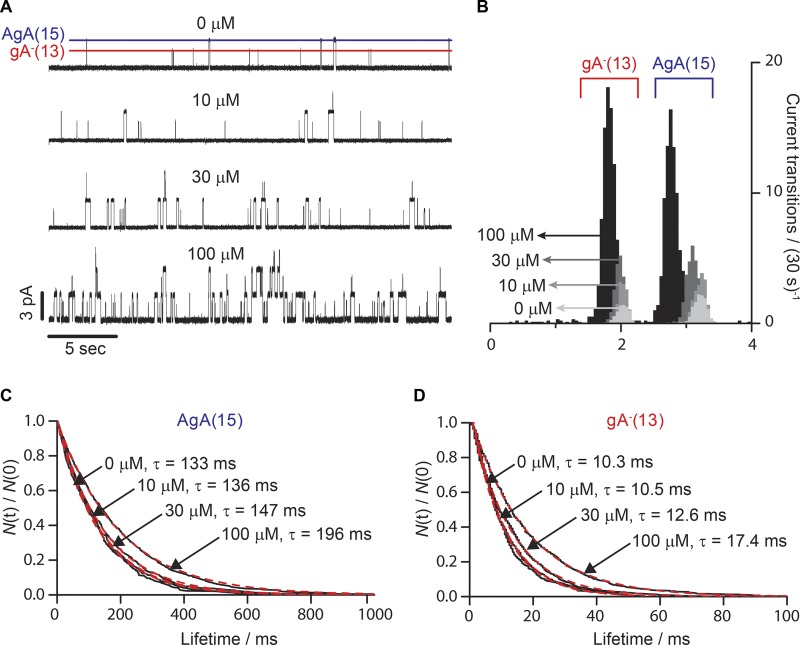
Figure 6.
Effect of amitriptyline on gA activity in the single-channel assay. (A) Single-channel current traces recorded with increasing concentrations of amitriptyline added to both sides of a DC18:1PC/n-decane bilayer doped with gA−(13) and AgA(15). The lines denote the current transition amplitudes for gA−(13) (red) and AgA(15) (blue). (B) Current transition amplitude histograms of gA−(13) and AgA(15). The darker the shading, the greater the amitriptyline concentration. In the absence of the drug, the characteristic current transition peaks were 3.2 ± 0.1 pA and 2.0 ± 0.1 pA for AgA(15) and gA−(13), respectively. 100 µM amitriptyline shifted the two peaks to 2.8 ± 0.1 and 1.8 ± 0.1 pA. (C and D) Normalized single-channel survivor histograms (black, solid lines) of AgA(15) (C) and gA−(13) (D). The histograms were fit with single exponential distributions (Eq. 7; red dotted lines), with lifetimes (τ).

