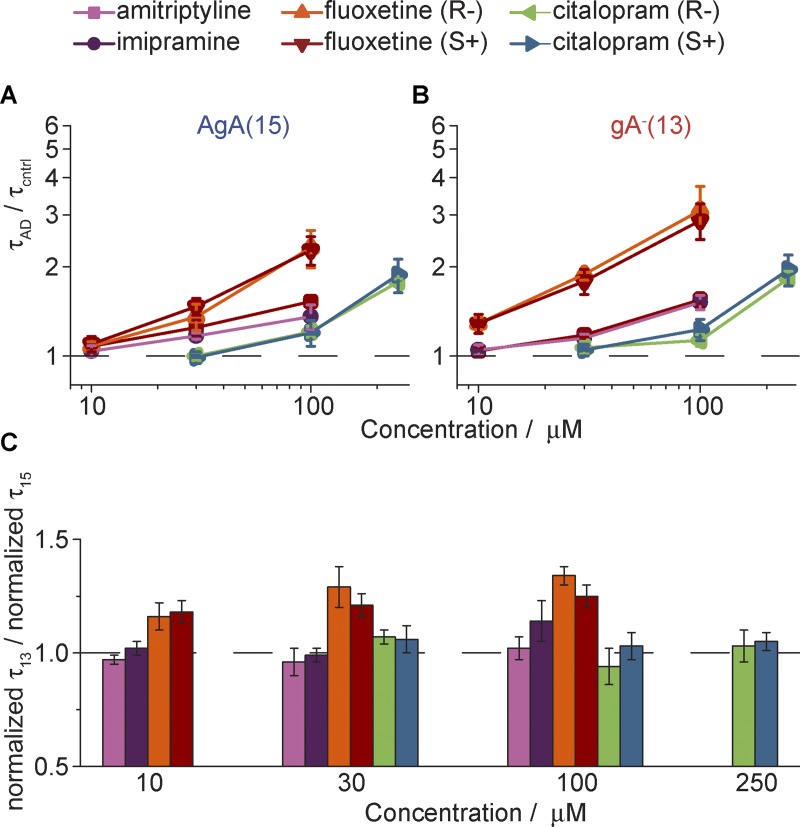
Figure 7.
Summary of effects of ADs on gA channel activity in the single-channel assay. (A and B) Normalized (A) AgA(15) and (B) gA−(13) lifetimes, τAD,15/τcntrl,15 and τAD,13/τcntrl,13, respectively, with increasing concentration of the given AD. The colors represent different ADs: amitriptyline (purple), imipramine (pink), fluoxetine (S+; red), fluoxetine (R−; orange), citalopram (S+; blue), citalopram (R−; green).. (C) The ratio of normalized gA−(13) versus the normalized AgA(15) single-channel lifetimes at different drug concentrations. A ratio >1 (denoted by the dashed line) indicates a greater effect on channels formed by the shorter gA analogue by the given drug at that concentration. Values represent mean ± SE; n = 3–4.

