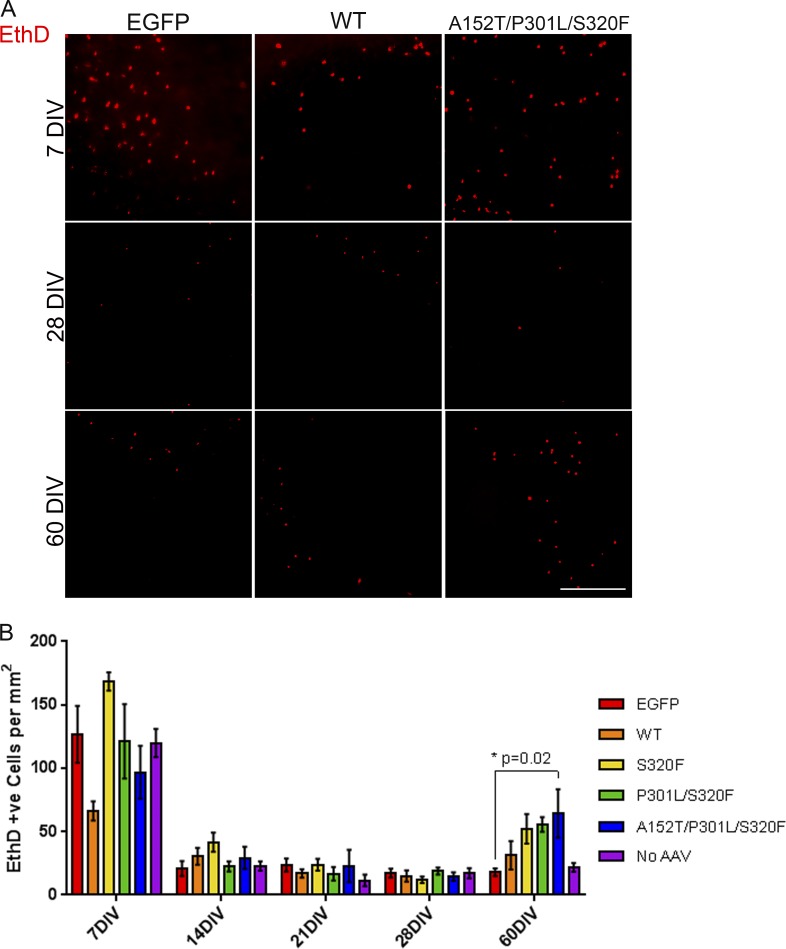
Figure 7.
Increased cell death follows mature neurofibrillary inclusion formations in tau-transduced BSCs. (A) Representative images of EthD-1 uptake (red fluorescence) in BSCs transduced with rAAV2/8-EGFP, rAAV2/8-WT-htau, or rAAV2/8-A152T/P301L/S320F-htau (1–2 × 10¹⁰ VGs per well) and imaged at 7, 28, and 60 DIV. Bar, 400 µm. (B) Bar chart shows numbers of EthD-1–positive (red) cells per mm2 in rAAV2/8-EGFP, rAAV2/8-WT-htau, rAAV2/8-S320F-htau, rAAV2/8-P301L/S320F-htau, rAAV2/8-A152T/P301L/S320F-htau, or no rAAV-transduced BSCs at 7, 14, 21, 28, and 60 DIV. Data are mean ± SEM. *, P < 0.05. n = 6–12.

