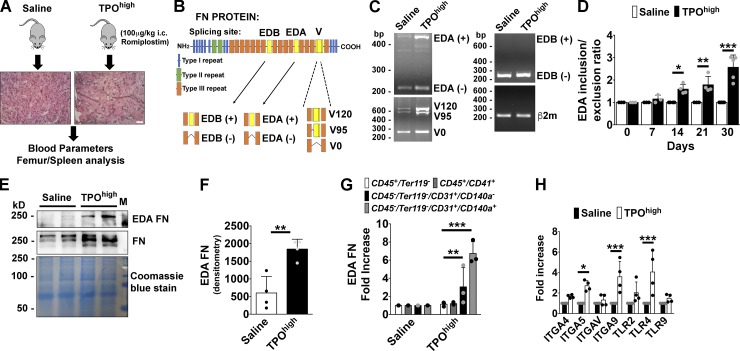
Figure 1.
Expression of EDA FN during BM fibrosis progression. (A) A TPOhigh mouse model was established to induced BM fibrosis in wild-type (wt/wt) mice. Mice received subcutaneous injections of either vehicle (saline, PBS) or romiplostim (100 µg/kg of body weight) every 3 d for 1 mo. Bar, 50 µm. (B) Scheme of alternative splicing sites in full-length FN subunit protein. (C) Splicing of alternative exon EDA, EDB exon, and V region of FN were analyzed by PCR assay in BM cells from saline-treated or TPOhigh mice. (+) mRNA indicates inclusion and (−) mRNA indicates exclusion of the EDA or EDB exon. Splicing of the V0, V120, and V95 variants of the V region are also indicated. β2m was used for comparative concentration analysis. (D) Densitometry analysis of the ratio between FN mRNA including and excluding EDA exon. Ratios were determined relative to saline treated mice (1.0) at days 0, 7, 14, 21, and 30 of TPO treatment. n = 4. (E) Cell-free fluids from femurs of saline or TPOhigh mice were analyzed for FN content in Western blotting. EDA FN was revealed with the antibody FN3E2 specific for EDA domain. Membrane was then reprobed with a polyclonal antibody to total FN. Coomassie blue staining was performed for comparative concentration analysis. (F) Densitometry analysis of EDA FN protein in cell-free BM fluids. Results were determined relative to saline-treated mice (1.0). n = 4. (G) Real-time PCR of EDA FN expression in sorted hematopoietic CD45+/Ter119− cells, CD45+/CD41+ Mk’s, CD45−/Ter119−CD31+ endothelial cells, and CD45−/Ter119−/CD31−/CD140a+ stromal cells from saline-treated or TPOhigh mice. n = 3. (H) Real-time PCR analysis of integrins and TLRs expression in BM cells from saline-treated or TPOhigh mice. n = 4. *, P < 0.05; **, P < 0.01; ***, P < 0.001. i.c., intracutaneous. Data are shown as mean ± SD.

