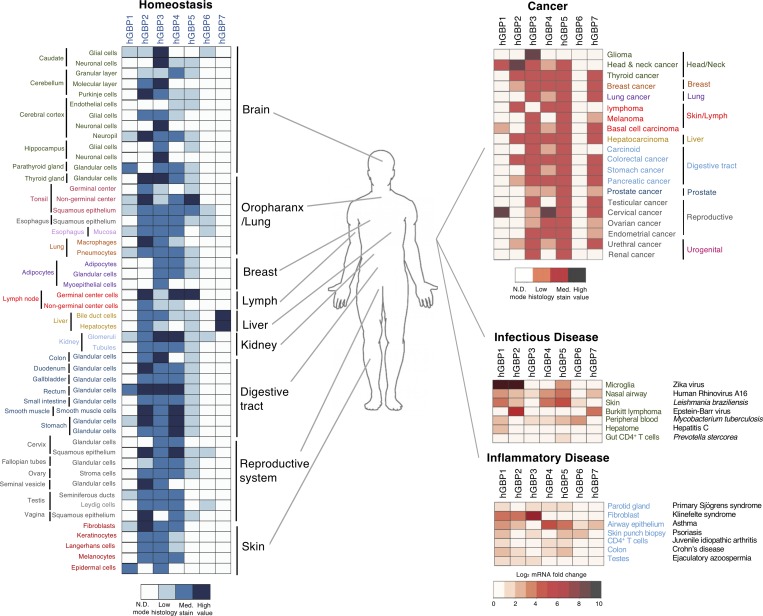
Figure 4.
Diverse GBP expression under homeostatic and disease conditions. Left: Homeostatic expression of different GBP proteins varies between human tissues. Heat maps generated from data deposited in the Human Protein Atlas consortium (https://www.proteinatlas.org/). mRNA data are shown for GBP7 due to a lack of antibody validation for this GBP. Right: GBP protein expression in human tissues during different disease states from the Human Protein Atlas consortium. Scale values shown in each case below heat maps. N.D., not detectable.

