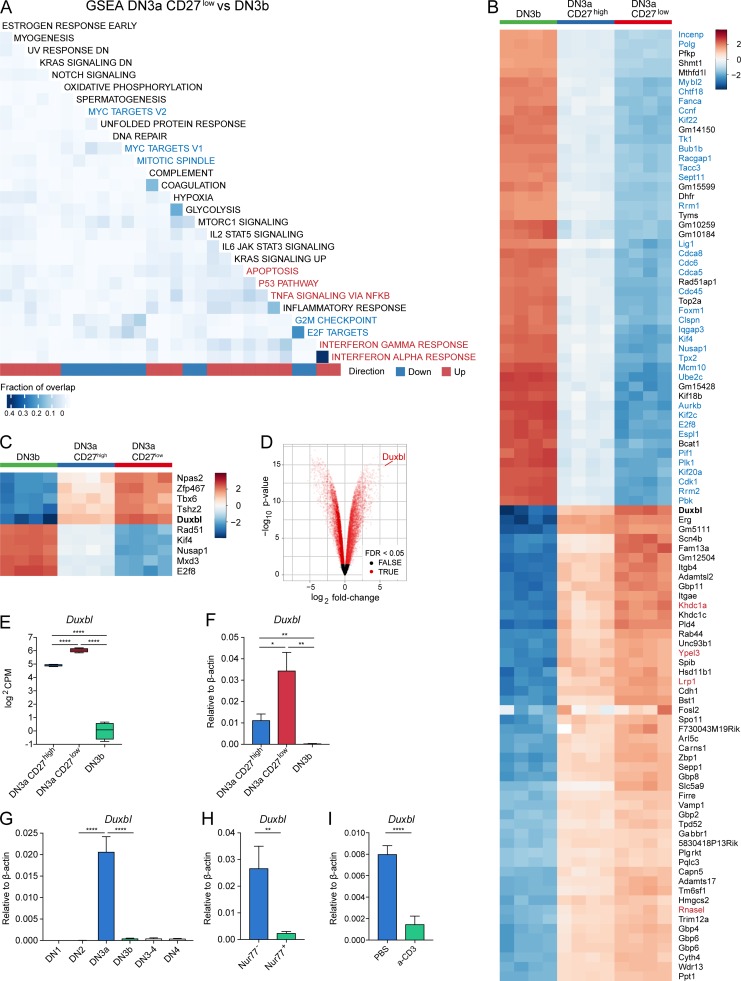
Figure 2.
Transcriptome comparison reveals specific up-regulation of the transcription factor Duxbl in DN3a CD27low cells. (A–C) Bulk RNA-seq of DN3a CD27high, DN3a CD27low, and DN3b cells, performed as described in Materials and methods. (A) Heat map illustrating the results of the gene set enrichment analysis (GSEA) of DN3a CD27low versus DN3b cells using gene sets from the hallmark collection of the Molecular Signature Database. Only sets containing >10 genes and with a false discovery rate (FDR) <5% are illustrated. The fraction of genes overlapping across gene sets is indicated by the color intensity on the heat map. Down-regulated hallmark signatures related to cell cycle/division and DNA replication are highlighted with blue font, and up-regulated ones related to apoptosis pathways in red font. (B) Heat map displaying the centered gene expression levels of the top 50 significantly overexpressed genes and top 50 significantly underexpressed genes in DN3a CD27low compared with DN3b cells. Genes are clustered using hierarchical clustering, but the dendrogram is not displayed. Duxbl is marked in bold font. The color gradient illustrates the normalized log2CPM values centered across all samples for each gene. (C) Heat map displaying the centered gene expression levels of the top 10 transcription factors (i.e., annotated to Gene Ontology category GO:0003677) with the highest absolute fold change among differentially expressed genes (FDR <0.05) between DN3a CD27low and DN3b cells. Duxbl is marked in bold font. The color gradient illustrates the normalized log2CPM values centered across all samples for each gene. (D) Volcano plot of differentially expressed genes between DN3a CD27low and DN3b cells. Genes with an FDR <0.05 are marked in red, and genes with an FDR >0.05 in black. (E and F) Normalized log2CPM obtained from the bulk RNA-seq (E) and relative expression obtained by qPCR (F) of Duxbl in DN3a CD27high, DN3a CD27low, and DN3b cells. (G) Relative expression of Duxbl in DN1, DN2, DN3a, DN3b, DN3-4, and DN4 cells. (H) Relative expression of Duxbl in Nur77− and Nur77+ DN3a CD27high cells isolated from Nur77GFP mice. (I) Relative expression of Duxbl in DN3 cells isolated from pTα−/− mice 1 d after intraperitoneal injection of 100 µg anti-CD3ε antibodies (n = 7) or PBS (n = 5). As housekeeping gene, β-actin was used. Data were collected from four (G and H) or three (F and I) independent experiments. DN stages were identified by FACS as shown in Fig. S1. Statistical analysis was done with two-tailed unpaired Student’s t test. *, P < 0.05; **, P < 0.01; ****, P < 0.0001. Error bars indicate standard deviation.

