Figure 3.
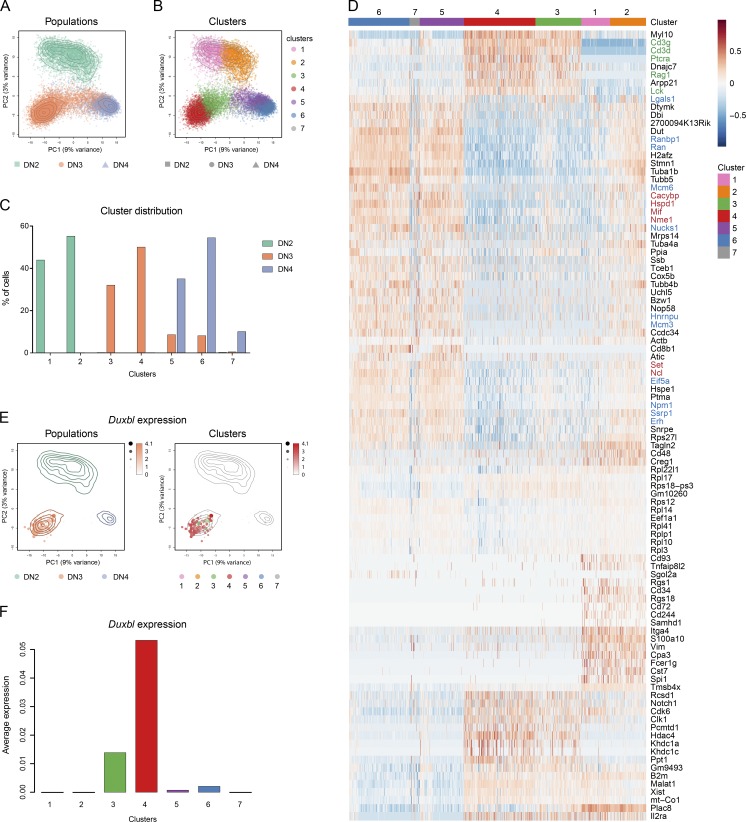
Single-cell RNA-seq elucidates a developmental trajectory through β-selection. Single-cell RNA-seq of DN2, DN3, and DN4 cells, performed as described in the Materials and methods. (A and B) PCA based on the 500 most variable genes across all cells. The colors represent cells from the different populations (A) or the different clusters (B). Contour lines indicate the density of the DN2, DN3, and DN4 cells in the PCA space. (C) Relative frequency of DN2, DN3, and DN4 cells within the different clusters. (D) Heat map displaying the centered and scaled expression across the 18,128 cells of the top cluster-specific genes (resulting from the union of the top 23 differentially expressed genes from each pairwise comparison between clusters). The color gradient illustrates the normalized log-count values centered and scaled across all samples for each gene. Colors at the top indicate the membership of cells to the different clusters. Font colors indicate genes involved in recombination and pre-TCR (green), cell cycle/division and DNA replication (blue), and negative regulation of apoptosis (red). (E) Expression of Duxbl shown in the PCA space. Size and color intensity of the dots indicate relative expression level of Duxbl in each cell, and the colors correspond to the respective population (left) or cluster (right). (F) Bar plot showing the average normalized log-counts of Duxbl across all cells from each cluster.

