Figure 6.
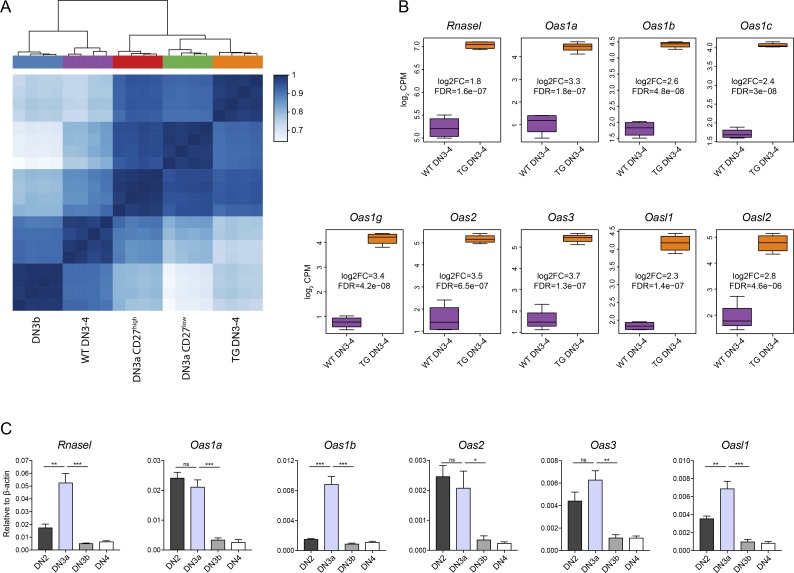
Gene expression analysis identifies up-regulation of the Oas/RNaseL system in Duxbl transgenic DN3-4 cells. (A and B) Bulk RNA-seq of WT and DuxblindxpTαCre DN3-4 cells, performed as described in the Materials and methods. (A) Heat map and hierarchical clustering based on the matrix of Spearman correlation across the samples of WT and TG (derived from DuxblindxpTαCre mice) DN3-4 cells together with WT DN3a CD27high, DN3a CD27low, and DN3b cells (using the 25% most variable genes). Data were corrected for batch effects across datasets. (B) Boxplots showing the normalized log2CPM of Rnasel, Oas1a, Oas1b, Oas1c, Oas1g, Oas2, Oas3, Oasl1, and Oasl2 in WT and TG (derived from DuxblindxpTαCre mice) DN3-4 cells. Log2 FC and false discovery rate (FDR) are indicated for each gene. (C) Relative expression of Rnasel, Oas1a, Oas1b, Oas2, Oas3, and Oasl1 in WT DN2, DN3a, DN3b, and DN4 cells. As housekeeping gene, β-actin was used. Data were collected from four independent experiments. Statistical analysis was done with two-tailed unpaired Student’s t test. *, P < 0.05; **, P < 0.01; ***, P < 0.001, ns, not significant. Error bars indicate standard deviation (B) or standard error of the mean (C).

