Figure 7.
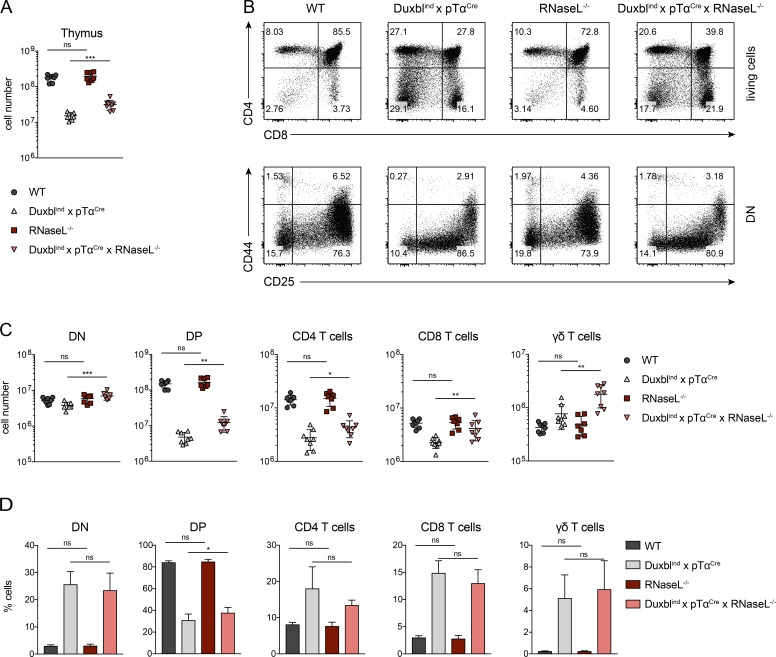
Disruption of the Oas/RNaseL system in DuxblindxpTαCre mice extenuates the perturbed T cell development. (A) Total number of live, nucleated cells in the thymus of WT (n = 8), DuxblindxpTαCre (n = 8), RNaseL−/− (n = 7), and DuxblindxpTαCrexRNaseL−/− (n = 8) mice. Data were collected from four independent experiments. (B) Representative FACS plots of CD4 and CD8 expression in total live cells (top) and CD44 and CD25 expression in DN cells (bottom) of WT, DuxblindxpTαCre, RNaseL−/−, and DuxblindxpTαCrexRNaseL−/− mice. DN cells were gated as CD4, CD8, CD3, and B220 negative. Four independent experiments were performed, with representative data from one experiment shown. (C) Numbers of DN, DP, CD4 T cells, CD8 T cells, and γδ-T cells in WT (n = 8), DuxblindxpTαCre (n = 8), RNaseL−/− (n = 7), and DuxblindxpTαCrexRNaseL−/− (n = 8) mice. (D) Frequencies of DN, DP, CD4 T cells, CD8 T cells, and γδ-T cells in WT (n = 8), DuxblindxpTαCre (n = 8), RNaseL−/− (n = 7), and DuxblindxpTαCrexRNaseL−/− (n = 8) mice. (C and D) Data were collected from four independent experiments. Gate numbers in FACS plots indicate frequencies of parent gate. DN stages were identified by FACS as shown in Fig. S1. Statistical analysis was done with two-tailed unpaired Student’s t test. *, P < 0.05; **, P < 0.01; ***, P < 0.001; ns, not significant. Error bars indicate standard deviation.

