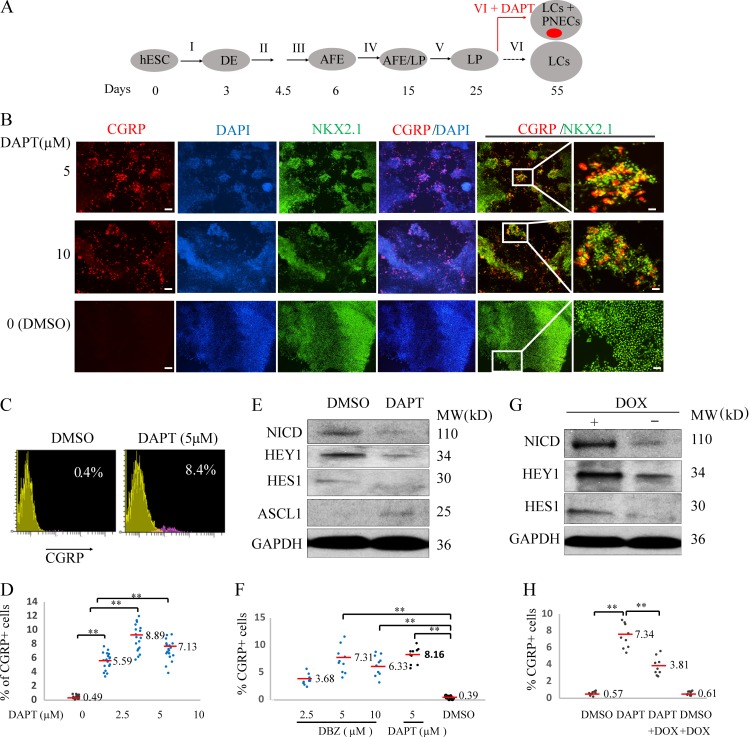
Figure 1.
Generating PNECs through directed differentiation of hESCs and suppression of NOTCH. (A) Schematic of the protocol used to generate PNECs by stepwise differentiation of hESCs to form DE by day 3, anterior foregut endoderm (AFE) by day 6, and increasing numbers of LPs from days 15 to 25, using the differentiation mixtures I–V (defined in Materials and methods section; Fig. 3 and Fig. S1). LPs were further differentiated in mixture VI from days 25 to 55 into the major types of LCs found in mature human lung parenchyma and airway epithelium (Warburton et al., 1998; Treutlein et al., 2014). Addition of DAPT to mixture VI induced formation of PNECs (red dot), as described in the text. (B) Detection of putative PNECs by IHC after treatment with DAPT. ESCs from the RUES2 line were differentiated according to the protocol in A to day 55 then stained to detect CGRP, NKX2.1, or both, with the indicated antisera; nuclei were detected by staining with DAPI. Scale bars, 100 µm (left) and 20 µm (right). (C and D) Percentages of CGRP+ cells were determined at day 55 by FACS and displayed as flow cytometry data (red, CGRP+; yellow, CGRP–) and a scatter graph (D). (E and F) Confirmation of mechanism of action of DAPT as inhibitor of γ-secretase cleavage of NOTCH. (E) DAPT (5 μM) treatment from day 25 to 55 decreased the level of the NICD and protein products of the NOTCH target genes, HES1 and HEY1, while increasing levels of ASCL1 in day 55 LCs, as detected by Western blot. (F) LPs treated with another γ-secretase inhibitor, DBZ, from day 25 to 55, also form CGRP+ cells at frequencies similar to those observed with DAPT (D). (G and H) Constitutive expression of NICD prevents the appearance of CGRP+ cells cotreated with DAPT. RUES2 cells carrying a DOX-inducible NICD were differentiated to form LPs and then treated with DOX, DAPT, or both for 30 d. The induction of NICD by DOX and expression of HES1 and HEY1 with Western blot are demonstrated in G; H shows by FACS that DOX (to induce expression of NICD) inhibits DAPT-mediated appearance of CGRP+ cells. **, P < 0.01; *, P < 0.05 by one-way ANOVA test or (for C) by Student’s t test. Horizontal red lines denote average values; number of biological repeats (n) = 18 for D, n = 10 for F, and n = 9 for H.

