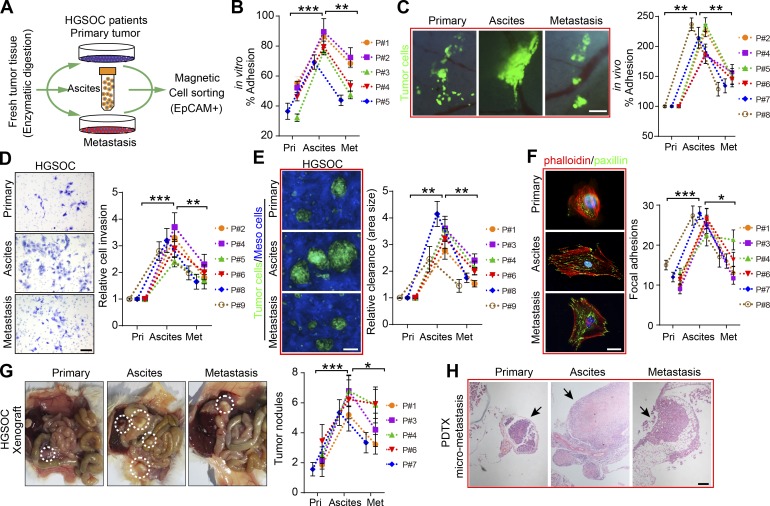
Figure 1.
ATCs are more adhesive and invasive than their matched counterparts in HGSOC patients. (A) Scheme depicting the EpCAM microbead-based magnetic sorting of epithelial tumor cells from primary tumors, ascites, and metastases from HGSOC patients. (B) Relative percentage of paired tumor cells from primary tumors (Pri), ascites, and metastases (Met) adhesion to the major ECM protein fibronectin in HGSOC patients (#1–5). (C–E) Representative images and quantification of paired tumor cell adhesion (#2, 4, and 5–8) in murine abdominal cavity (C), tumor cell invasion (#2, 4–6, 8, and 9; D), and mesothelial clearance in HGSOC patients (#1, 3, 4, 6, 8, and 9; E). Bars, 200 µm (C), 50 µm (D), and 100 µm (E). (F) Immunofluorescence of the cytoskeleton (phalloidin) and FAs (paxillin) in paired tumor cells (#1, 3, 4, and 6–8) after exposure to a fibronectin-coated substrate FA measurements; n = 20. Bar, 20 µm. (G) Representative images and quantification of patient-derived tumor xenograft formation in mice implanted intraperitoneally with an equivalent number of paired tumor cells (#1, 3, 4, 6, and 7; n = 6 mice per group). (H) Representative H&E staining images of micrometastases formed by intraperitoneal implantation of equal amounts of paired tumor cells (#7). Bar, 200 µm. Data are means ± SEM and representative of four (B–F) or two (G and H) independent experiments. *, P < 0.05; **, P < 0.01; ***, P < 0.001; determined by paired Student’s t test.

