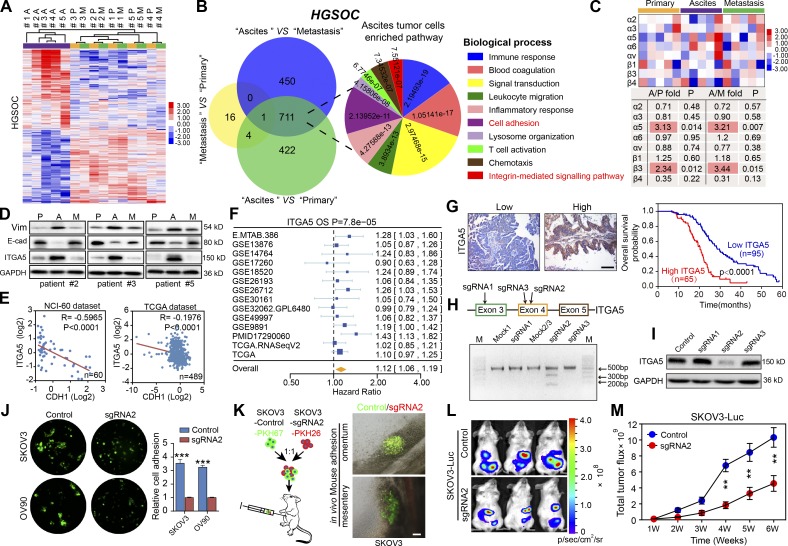
Figure 2.
ITGA5high ATCs are crucial to OC peritoneal metastasis. (A) Hierarchical clustering of differentially expressed genes among 15 epithelial tumor cell specimens isolated from the primary tumors (P), ascites (A), and metastases (M) of HGSOC patients (#1–5). (B) Venn diagram of the common signature genes differentially expressed between tumor cells of different origins and major biological processes represented in the gene sets specifically elevated in ATCs with their related statistical significances. (C) Expression levels of the relevant integrin family members in tumor cells of different origins. (D) Immunoblotting of ITGA5, E-cadherin, and Vim in freshly isolated paired tumor cells. (E) Pearson correlation analysis between ITGA5 and CDH1 mRNA expression in NCI-60 cells and in OC patient tissues from the TCGA dataset. (F) Meta-analysis depicting forest plots of ITGA5 expression as a univariate predictor of overall survival (OS). (G) Left: Representative images of low and high ITGA5 expression in OC tumor tissues. Right: Kaplan–Meier curves for overall survival probability in 160 serous OC patients with low (n = 95) and high (n = 65) ITGA5 protein expression (analyzed with log-rank test). Bar, 100 µm. (H) Editing ITGA5 in SKOV3 using CRISPR/Cas9 system. Top: Schematic diagram of sgRNAs 1–3 targeting exon 3/4 of ITGA5. Bottom: The genomic PCR products of SKOV3 cells transduced with scrambled sgRNA (mock) or sgRNA1–3 were analyzed with a T7E1 assay. (I) SKOV3 cells transduced with scrambled sgRNA (control) or sgRNA1-3 were subjected to immunoblotting with ITGA5. (J) Analyses of in vitro adhesion of SKOV3 or OV90 cells in the control or sgRNA2 group. (K) Schematic illustration of in vivo adhesion for equivalent numbers of PKH-67–labeled control and PKH-26–labeled sgRNA2 transduced SKOV3. Bar, 100 µm. (L and M) Representative bioluminescence images (L) and growth curves (M) developed by control SKOV3 and ITGA5-deficient (sgRNA2 group) SKOV3 cells (n = 10 mice per group). Data are means ± SEM. Data are one experiment (A–C and E–G) and representative of two (D, H, I, L, and M) or three (J and K) independent experiments. **, P < 0.01; ***, P < 0.001, determined by Student’s t test.

