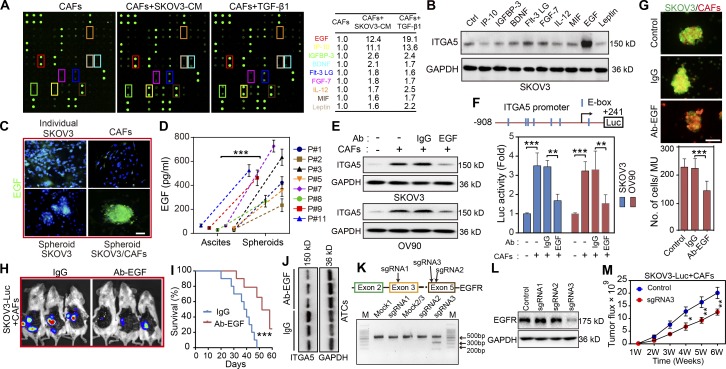
Figure 6.
CAF-dependent EGF secretion is required for ATC ITGA5 expression in MUs. (A) Cytokine profile from control CAFs (#1), and from CAFs primed either with SKOV3 CM or with TGF-β1 (100 ng ml–1) for 48 h. The shared cytokines elevated in CAFs treated with CM or TGF-β1 are listed. (B) Western blot analysis of ITGA5 in SKOV3 cells treated with variant cytokines for 48 h. (C) Representative immunofluorescence images of EGF in SKOV3 and CAFs (#8 and 9) in adherent culture, in SKOV3 homospheroids, and in MUs formed by SKOV3 and CAFs. Bar, 50 µm. (D) EGF secretion in the MU microenvironment and in the corresponding ascites macroenvironment of eight HGSOC patients was assessed by ELISA. (E) Immunoblotting for ITGA5 in control and in isolated tumor cells following coculture with CAFs (#6 and 8) in MUs, in the presence or absence of either EGF-neutralizing antibody or IgG control. (F) Schematic representation of the ITGA5 promoter reporter constructs (top) and analysis of ITGA5 promoter activity (bottom) in variant tumor cell groups, as described in E. (G) Representative images and quantification of heterotypic spheroid formation by SKOV3 and CAFs (#4, 9, and 10), in the presence or absence of IgG or EGF-neutralizing antibody. Bar, 100 µm. (H and I) Representative i.p. bioluminescence images (H) and survival curves (I) for mice bearing tumors generated by coinjection of SKOV3-Luc and CAFs (#7 and 9) in the control IgG and the EGF-neutralizing antibody group (n = 10 mice per group). (J) Immunoblot of ITGA5 in peritoneal tumor cells isolated from the groups treated with either control IgG or EGF-neutralizing antibody. (K) Editing EGFR in SKOV3 using the CRISPR/Cas9 system. Top: Schematic diagram of sgRNA1-3 targeting exon 3/5 of the EGFR gene. Bottom: The genomic PCR products of SKOV3 cells transduced with scrambled sgRNA (mock) or sgRNA1-3 were analyzed with T7E1 assay. (L) SKOV3 cells transduced with scrambled sgRNA (control) or sgRNA1-3 were subjected to immunoblotting with EGFR. (M) Tumor growth curves developed by control and EGFR-deficient SKOV3-Luc cells in combination with CAFs (#9 and 10; n = 10 mice per group). Data are means ± SEM and representative of two (A, B, E, and H–M) or three (C, D, F, and G) independent experiments. *, P < 0.05; **, P < 0.01; ***, P < 0.001, determined by Student’s t test.

