Figure 6.
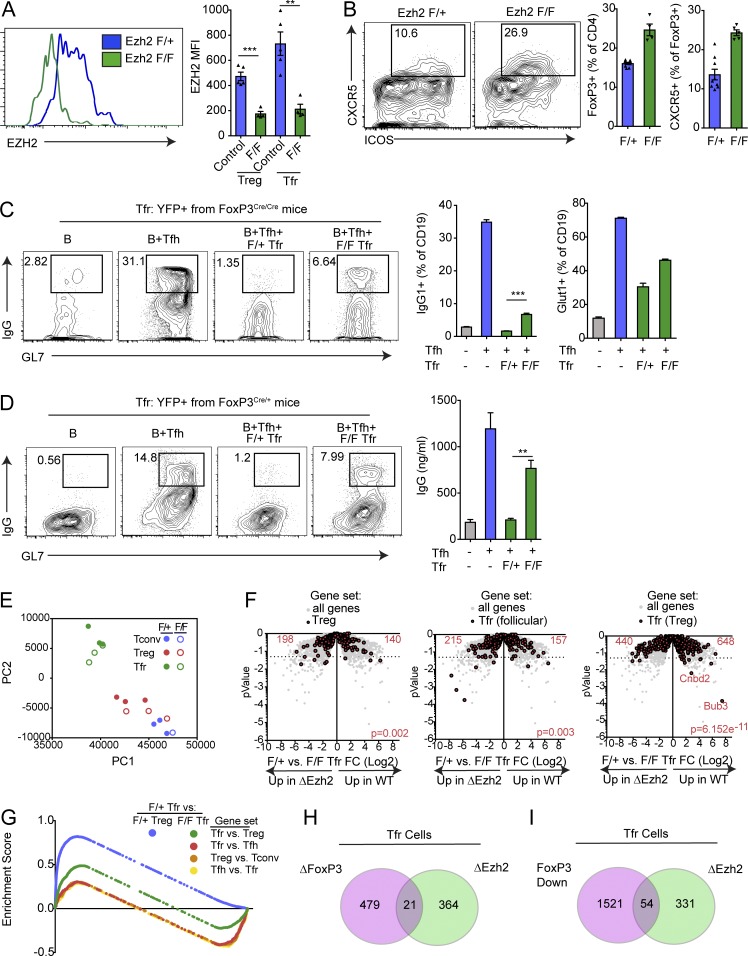
Ezh2 is required for Tfr suppressive function and transcriptional program. (A) Conditional deletion of Ezh2 on T reg cells. Ezh2f/fFoxP3Cre/Cre or control (Ezh2f/+FoxP3Cre/Cre) mice were immunized with NP-OVA, and 7 d later, T reg and Tfr cells were analyzed for expression of Ezh2 by flow cytometry. Representative gating (left) and quantification (right) are shown. MFI, mean fluorescence intensity. (B) Loss of Ezh2 results in increased Tfr cell percentages. Mice as in A were analyzed for Tfr cells. Representative gating (left) and quantification (middle, right) are shown. (C) Ezh2-deficient Tfr cells are less suppressive. In vitro suppression assay in which B and Tfh cells were cultured alone or along with Ezh2-sufficient or -deficient cells sorted as in B. IgG1+GL7+ class-switched B cells gating (left), IgG1+GL7+ class switched B cell quantification (middle), and quantification of Glut1 expression on B cells (right) are shown. (D) Ezh2 deficiency leads to a cell-intrinsic loss of Tfr cell suppressive function. Tfr cells from Ezh2f/fFoxP3Cre/+ or Ezh2f/+FoxP3Cre/+ mice (sorted based on Cre-YFP) were used for suppression assays as in C. Representative flow cytometry of IgG1+GL7+ class-switched B cells (left) and IgG secretion (right) are shown. (E) Loss of Ezh2 results in loss of the Tfr cell transcriptional program. PCA of RNA-seq transcriptional data from Ezh2-deficient (Ezh2f/fFoxP3Cre) or Ezh2-sufficient (Ezh2f/+FoxP3Cre) Tfr and T reg cells sorted as in B. (F) Volcano plots showing control or Ezh2-deficient Tfr cell RNA-seq data with total T reg genes (T reg versus T conv; left), Tfr (follicular) genes (Tfr versus Tfh; middle), and Tfr (T reg) genes (Tfr versus T reg; right; from Fig. 1; in red) compared with all genes (gray). P value was calculated using a χ2 test. (G) Enrichment score traces from GSEA analysis comparing Ezh2 F/+ Tfr cells versus F/+ T reg or F/F Tfr cells using indicated gene sets (generated from data in Fig. 1). (H and I) Venn diagram illustrating the overlap of genes differentially expressed in Ezh2-deficient Tfr cells versus control Tfr cells (ΔEzh2) compared with either genes differentially expressed in FoxP3-deleted Tfr cells compared with control Tfr cells (ΔFoxP3) or genes differentially expressed in in vitro generated ex-Tfr versus Tfr cells (FoxP3 Down). All error bars indicate standard error. **, P < 0.01; ***, P < 0.001 using Student’s t test. Data are from individual experiments and are representative of three independent experiments (A and B), are from individual experiments of triplicate wells and are representative of three independent experiments (C and D), or are combined data from three independent experiments (E and F).

