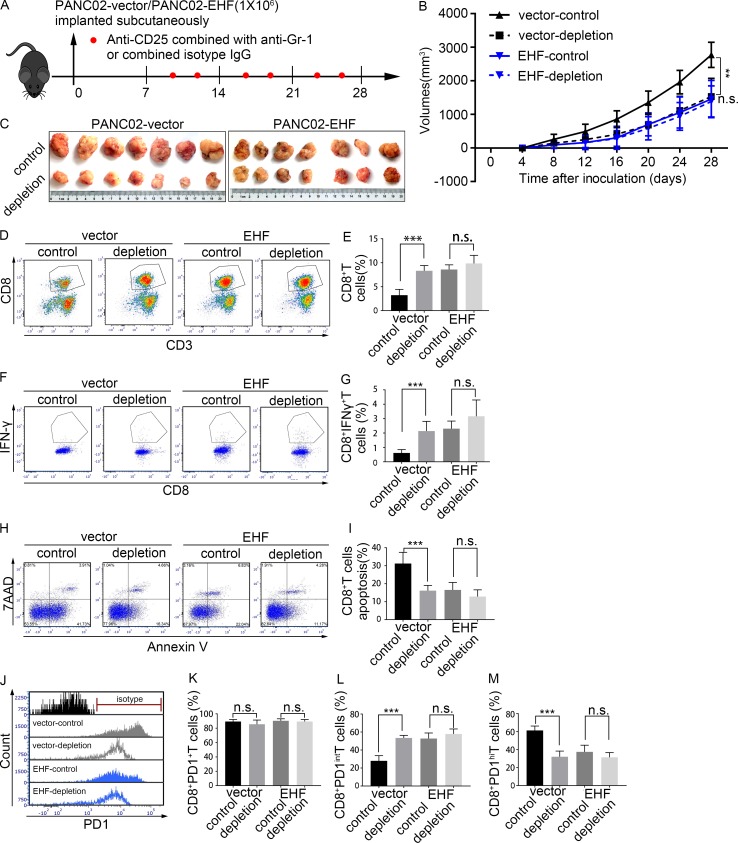
Figure 7.
EHF-low tumors can benefit from T reg cell and MDSC depletion treatment. (A) Anti-mouse CD25 antibody combined with anti-mouse Gr-1 antibody (or combined isotype control) was injected intraperitoneally two times a week, 7 d after tumor inoculation (red plots represent the time points of drug administration). T reg cell and MDSCs depletion therapy efficacy was evaluated in PANC02-vector and PANC02-EHF tumors, respectively. Tumor volumes were measured every 4 d using calipers. (B) Tumor growth curves of the four groups. Repeated measure two-way ANOVA (time × tumor volume) and post hoc analysis were used to test mouse tumor growth between groups. (C) Effects of T reg cell and MDSC depletion therapy on tumor growth in the PANC02-vector and PANC02-EHF groups. Tumors at the end point of the experiment are also shown (left, PANC02-vector; right, PANC02-EHF). (D and E) Representative plots (D) and statistical analyses (E) of tumor-infiltrating CD8+ T cells in tumors that received T reg cell and MDSCs depletion therapy or isotype IgG (left, vector group; right, EHF group). (F and G) Representative plots (F) and statistical analyses (G) of tumor-infiltrating IFNγ+CD8+ T cells. (H and I) Representative plots (H) and statistical analyses (I) of tumor-infiltrating CD8+ T cell apoptosis. (J) Histogram of tumor infiltration by PD1+CD8+ T cells, PD1intCD8+ T cells, and PD1hiCD8+ T cells in the four groups. (K–M) Percentage of PD1+CD8+ T cells, PD1intCD8+ T cells, and PD1hiCD8+ T cells in tumors that received T reg cell and MDSC depletion therapy or isotype IgG. Data are presented as mean ± SD. Nonpaired Student’s t test was used for statistical analysis; **, P < 0.01, ***, P < 0.001; n.s., not significant. All mouse experiments were repeated three times independently, using seven mice per experimental group. Representative data are shown.

