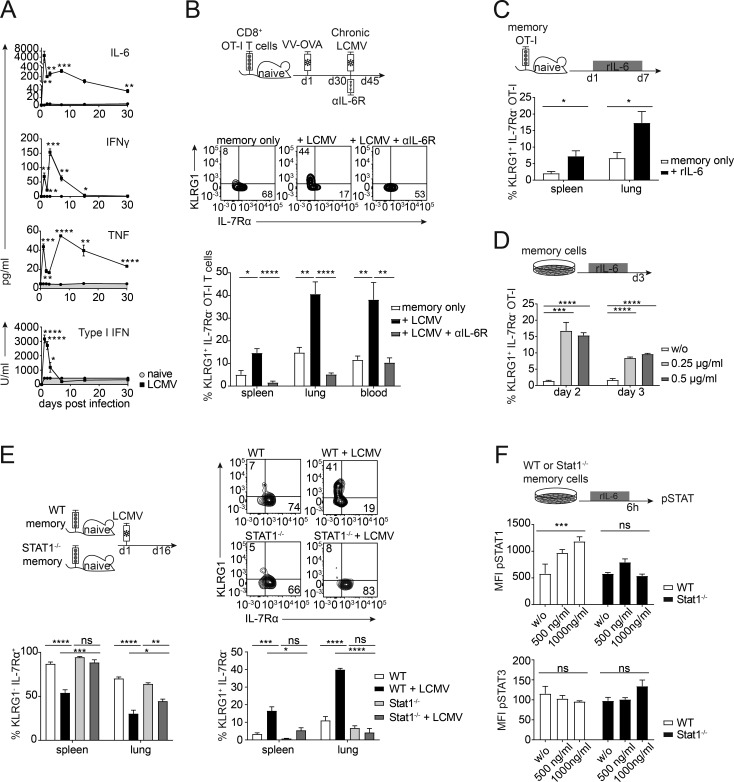
Figure 6.
IL-6 drives phenotypic alterations of memory bystander T cells. (A) Cytokine levels in the serum over 30 d of infection (LCMV, open squares) and naive controls (naive, gray circles, gray area) were measured by CBA (IL-6, IFNγ, and TNF) or IFN bioassay (type I IFNs). (B) Top: Experimental approach. Adoptive transfer of CD45.1+ OT-I CD8+ T cells into congenic CD45.2 WT C57BL/6 mice, followed by priming with VV-OVA. On day 30 after priming, mice were persistently infected with LCMV docile. From the onset of the infection, αIL-6R blocking antibody was injected i.p. every second day. The experiment was terminated 15 d after LCMV infection. Middle: Representative flow cytometry plots of the expression of KLRG1 and IL-7Rα of memory only, + LCMV, and +LCMV + αIL-6R. Bottom: Quantification of percentages of KLRG1+ IL-7Rα− OT-I T cells shown for memory only (white, uninfected) + LCMV (black), and +LCMV + αIL-6R (gray) in the spleen, lung, and blood. (C) Top: Experimental approach. Adoptive transfer of CD45.1+ OT-I CD8+ T cells into congenic CD45.2 WT C57BL/6 mice, followed by priming with VV-OVA. On day 30 after priming, mice were injected with 1 µg of rIL-6 every day for 1 wk. Bottom: Quantification of percentages of KLRG1+ IL-7Rα− OT-I T cells shown for memory only (white, uninfected) and +rIL-6 (black) in the spleen and lung. (D) Top: Experimental approach. FACS-sorted memory OT-I CD8+ T cells were cultured in vitro with or without rIL-6 for 3 d. Bottom: Quantification of percentages of KLRG1+ OT-I T cells shown for no cytokine (w/o, white), 0.25 µg/ml (light gray), and 0.5 µg/ml (dark gray). (E) Top left: Experimental approach. Adoptive transfer of 5 × 10⁵ CD45.1+ WT memory OT-I or CD45.1+ Stat1−/− memory OT-I CD8+ T cells into congenic CD45.2+ WT C57BL/6 mice. 1 d after transfer, mice were persistently infected with LCMV docile. The experiment was terminated 15 d after LCMV infection. Top right: Representative flow cytometry plots of the expression of KLRG1 and IL-7Rα for WT OT-I ± LCMV and Stat1−/− OT-I ± LCMV memory bystander T cells. Bottom: Quantification of percentages of KLRG1+ IL-7Rα− OT-I T cells and KLRG1− IL-7Rα+ OT-I T cells shown for WT (white, uninfected), WT + LCMV (black), Stat1−/− (light gray), and Stat1−/− + LCMV (dark gray) in the spleen and lung. (F) Experimental approach. FACS-sorted WT or Stat1−/− memory OT-I CD8 T cells were cultured in vitro with or without rIL-6 for 6 h. Bottom: Quantification of mean fluorescence intensity (MFI) of pSTAT1+ and pSTAT3+ WT (white) or Stat1−/− (black) OT-I T cells shown for no cytokine (w/o), 500 ng/ml and 1000 ng/ml. One representative experiment out of two is shown with four to five mice per group (A–C and E) or triplicates for the in vitro experiments (D and F). Statistical analysis was performed using the unpaired two-tailed Student’s t test: ns, P ≥ 0.05; *, P < 0.05; **, P < 0.01; ***, P < 0.001; ****, P < 0.0001. Error bars show SEM.

