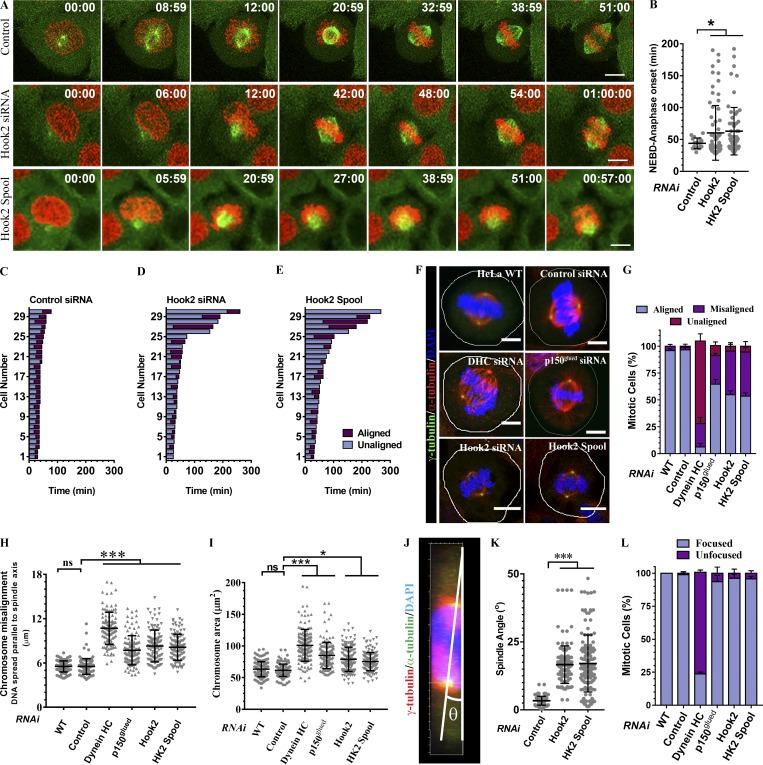
Figure 5.
Hook2 depletion results in mitotic progression defects. (A) Maximum intensity projections of z-stacks of live-cell time-lapse imaging from HeLa cells stably expressing GFP–α-tubulin and H2B-mCherry and transfected with indicated siRNA. Cells were imaged every 3 m to monitor mitotic progression in each case. Bars, 10 µm. (B) Quantification of time taken from the NEBD to anaphase onset in cells transfected with control or Hook2 siRNA measured (n = 2; 40 mitotic events/experiment). (C–E) Quantification of mitotic timing and chromosome alignment of live-cell imaging experiment shown in A. Asynchronous cells were imaged for the duration of 12 h, and images were acquired every 3 m. Bars in the graph represent total time spent in mitosis for individual cells from a single experiment. Gray bars indicate time spent with unaligned chromosomes, and violet bars indicate time spent with full chromosome alignment. The starting point is NEBD, and the end of the bar represents either anaphase onset or death in mitosis (n = 2; 15 cells/experiment). (F) Representative images of mitotic HeLa cells treated with indicated siRNA. Centrosomes were stained with γ-tubulin and MTs with α-tubulin, and chromosomes were visualized with DAPI. Bars, 5 µm. (G) Quantification of chromosome misalignment from cells described in F (n = 3; 100 mitotic cells/experiment). (H) The extent of chromosome misalignment shown as a dot plot. To calculate the extent of chromosome misalignment, the DNA spread parallel to spindle pole axis was measured using ImageJ software (n = 3; 100 mitotic cells/experiment). (I) The extent of chromosome congression shown as a dot plot. To calculate the extent of chromosome congression, the area of DNA spread inside each mitotic cell was measured using ImageJ software (n = 3; 100 mitotic cells/experiment). (J) Schematic showing the calculation of spindle positioning defect measured as a function of an angle between spindle pole axis and substratum. (K) Quantification of spindle positioning defect upon Hook2 depletion in HeLa cells (n = 3; 35 metaphase cells/experiment). (L) Quantification of spindle pole focusing in HeLa cells treated with indicated siRNAs (n = 3; 100 metaphase cells/experiment). Data represent mean ± SD (ns, not significant; *, P < 0.1; ***, P < 0.001; Student’s t test).

