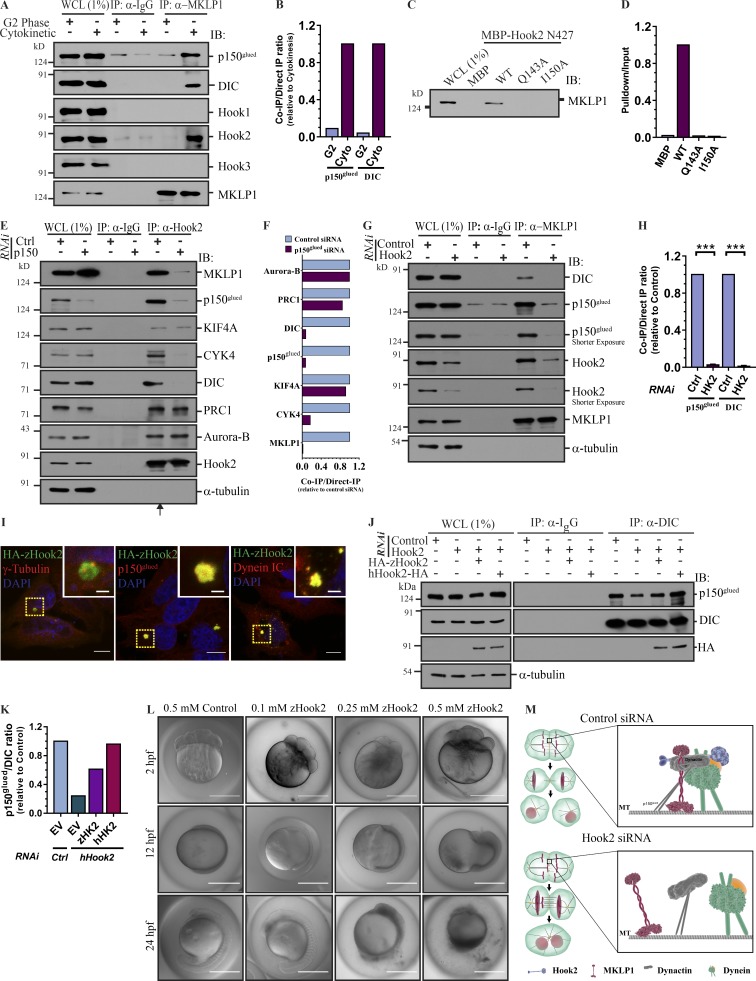
Figure 9.
Hook2 is required for p150glued and MKLP1 interaction during cytokinesis. (A) Lysates of HEK293T cells synchronized in either G2 phase or cytokinesis were IP with control IgG or anti-MKLP1 antibody and IB with indicated antibodies. (B) Ratio of normalized band intensity (cytokinesis lane) of IP p150glued and DIC to MKLP1 in A (n = 2). (C) Whole-cell lysates of HEK293T cells harvested during the cytokinesis stage were incubated with either MBP or MBP-tagged Hook2 N427 (WT, Q143A, and I150A) and IB for MKLP1. (D) Ratio of band intensity of pulldown to input Hook2 (WT/mutants) signal in C (n = 2). (E) Lysates of HEK293T cells treated with control or p150glued siRNA and harvested during cytokinesis stage were IP with control IgG or anti-Hook2 antibody and IB with the indicated antibodies. (F) Ratio of normalized band intensity (control siRNA) of coIP proteins (as indicated) to MKLP1 in E (n = 2). (G) Lysates of HEK293T cells transfected with indicated siRNA and harvested during cytokinesis stage were tested for dynactin association with MKLP1. (H) Ratio of normalized band intensity (control siRNA) of IP p150glued and DIC to MKLP1 in G (n = 3). (I) Representative images of HeLa cells ectopically expressing HA-tagged zebrafish Hook2 (HA-zHook2) costained for centrosomes, dynein, and dynactin. Bars, 10 µm; insets, 2 µm. (J) Lysates from asynchronous HEK293T cells treated with indicated siRNA and transfected with indicated plasmids were IP with control IgG or anti-DIC antibody and IB for p150glued. (K) Ratio of normalized band intensity (control siRNA) of IP p150glued to DIC in J (n = 2). (L) Representative differential interference contrast images of zebrafish embryos injected with either nontargeting control morpholino or indicated concentration of zHook2 morpholino immediately after fertilization and imaged at the indicated time. Each concentration of morpholino was injected in 100 fertilized embryos and monitored over time. Bars, 500 µm. Data represent mean ± SD (ns, not significant; ***, P < 0.001; Student’s t test). (M) Proposed model depicting the role of Hook2 in mediating formation of dynein–dynactin complex and targeting of MKLP1 to the spindle midzone.

