Figure 1.
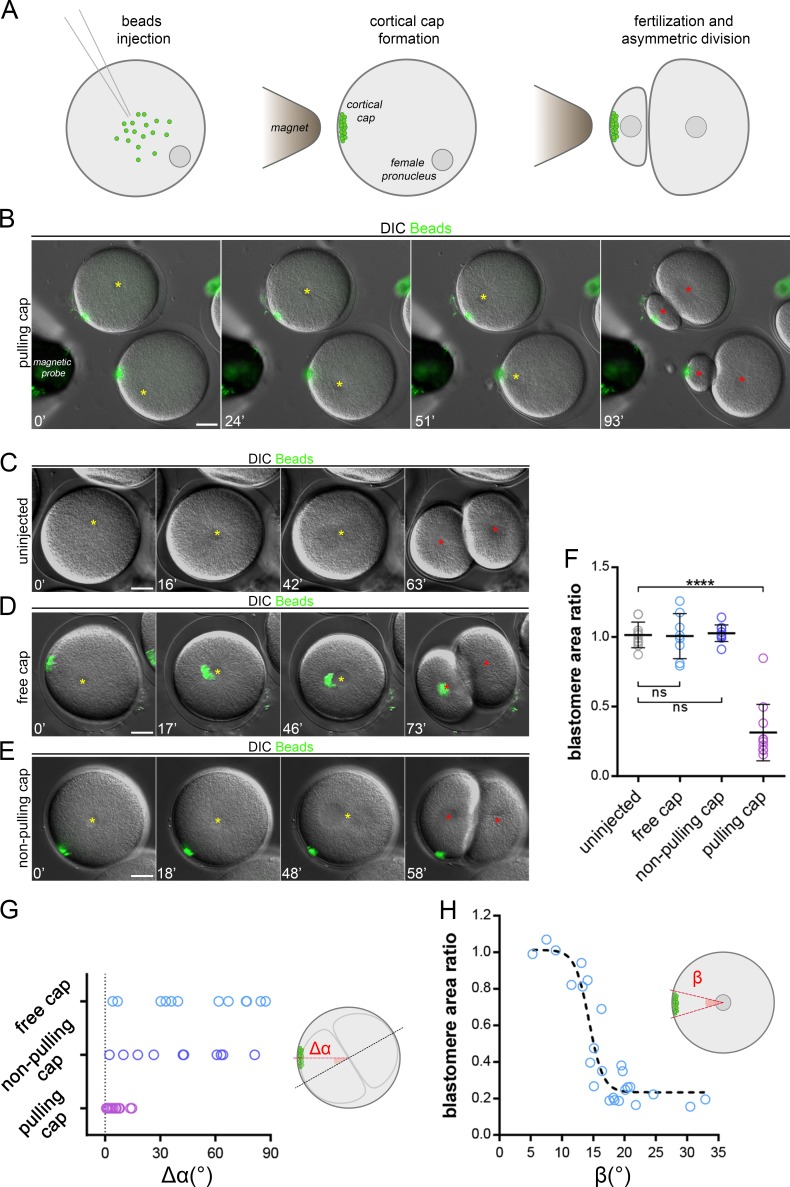
Magnetic cortical pulling domains drive marked asymmetric divisions. (A) Magnetic beads injection, cap formation, and induced asymmetric division. (B–E) Time-lapse images of the cleavage of sea urchin zygotes. (B) The cap is formed with beads with strong MT minus end activity and maintained; (C) a noninjected control embryo; (D) the pulling cap is not maintained; and (E) a control using a cap formed with beads that do not interact with MTs. Yellow stars: female/zygote nucleus; red stars: blastomere nuclei after division. (F) Divided blastomere area ratio in conditions B to E (n = 10, n = 8, n = 11, and n = 10 cells). (G) Quantification of the angle (Δα) between the division axis and the axis from the cell center to the cap (n = 12, n = 17, and n = 10 cells). (H) Blastomere area ratio plotted as a function of the angle (β) formed by the edges of the pulling cap and the cell center. The dashed line is a visual guide. Results were compared by using a two-tailed Mann–Whitney test. ns, P > 0.05; ****, P < 0.0001. Error bars are SD. Bars, 20 µm.

