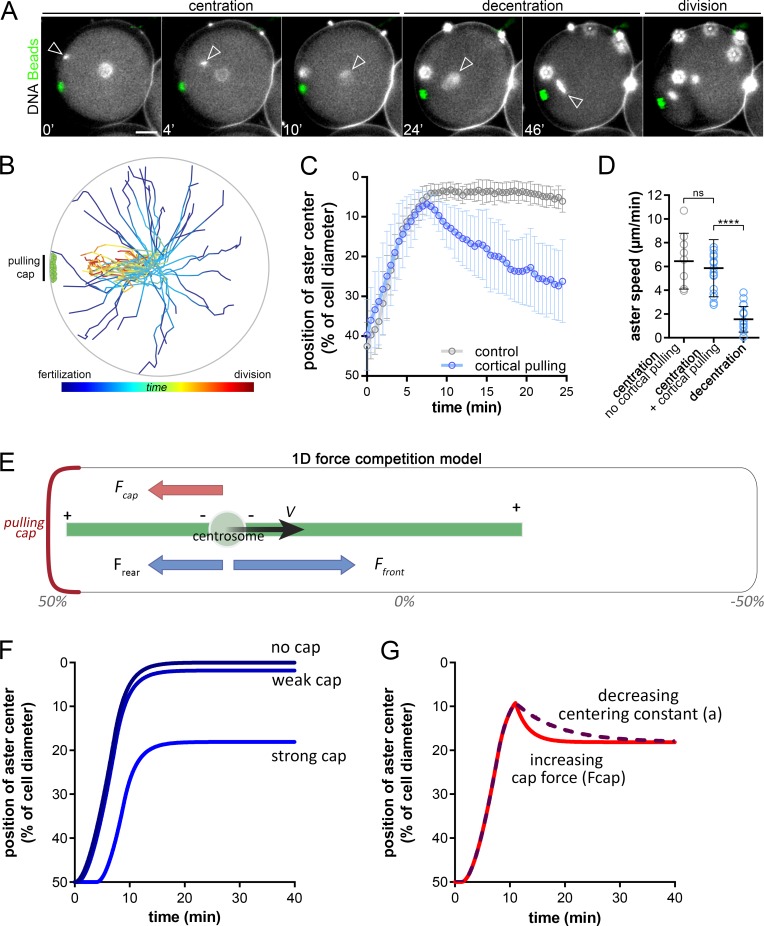
Figure 2.
Consecutive aster centration and decentration. (A) Time-lapse of the consecutive centering motion of the male nucleus followed by a decentration of the zygote nucleus toward the cap. Arrowheads: nuclei at the aster center; red stars: blastomere nuclei. Contrast is adjusted to compensate for an increase in DNA labeling (Hoechst), and bright blobs correspond to excess sperm on the fertilization envelope. (B) Aster trajectories from fertilization to metaphase onset, aligned with the pulling cap (n = 32 cells). (C) Aster position with and without cortical caps (n = 18 and n = 9, respectively). (D) Aster velocity during centration and decentration (n = 18, n = 17, and n = 17 cells). (E) 1D force competition model with a pulling cap force (in red) and length-dependent pulling forces (in blue). (F) Simulated aster position under no, weak, or strong cortical forces. (G) Simulated aster position, with a decreasing centering constant, a (purple) or an increasing cap force, Fcap, after centration (red). Results were compared by using a two-tailed Mann–Whitney test. ns, P > 0.05; ****, P < 0.0001. Error bars are SD. Bars, 20 µm.

