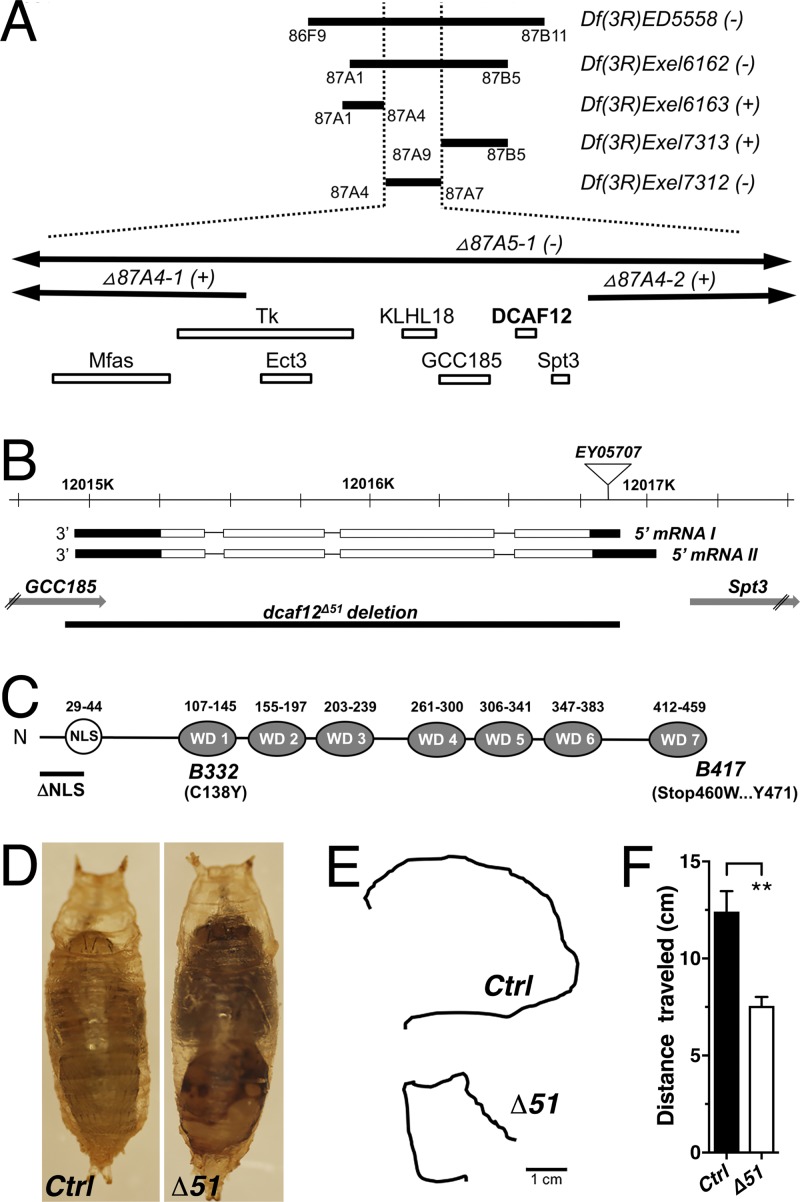
Figure 1.
Genetic and molecular analysis of DCAF12. (A) Deficiency (Df) mapping of alleles B332 and B417. Closed and open bars indicate deficiencies and genes, respectively. (B and C) Structure of the dcaf12 gene and DCAF12 protein. (D) 3-d-old control (w1118) and Δ51 mutant pupae. (E and F) Traces (E) and quantification (F) of crawling from control and Δ51 third-instar larvae (means ± SEM; n ≥ 6; **, P < 0.004; two-tailed unpaired t test).

