Figure 3.
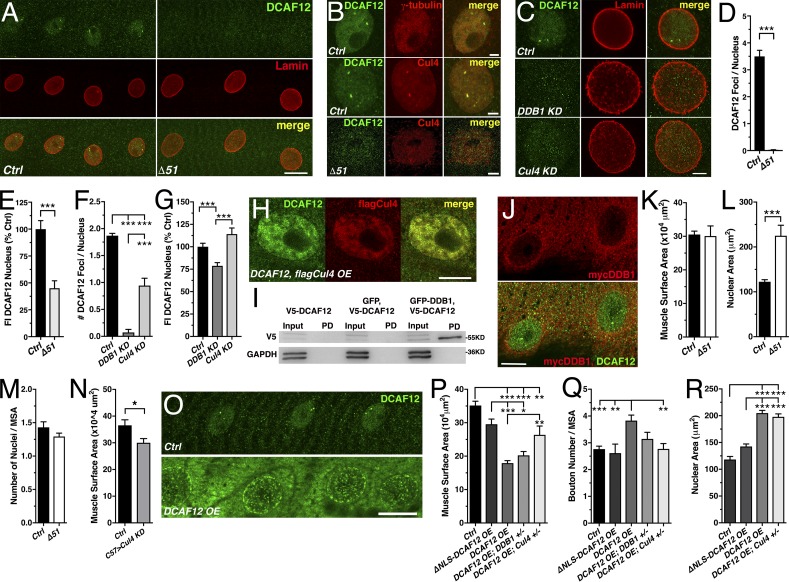
Nuclear DCAF12 interacts with Cul4. (A) Muscle nuclei stained for DCAF12 (GP11) and Lamin-C. (B and C) Muscle nuclei stained for DCAF12 (B and C) and γ-tubulin (B), Cul4 (B), or Lamin-C (C). (D–G) Amount of DCAF12 foci (D and F) and levels (E and G) in muscle nuclei (n ≥ 35; [D and E], n ≥ 9; [F and G], n ≥ 3). (H) Muscle nuclei stained for coexpressed DCAF12 and flagCul4. (I) Western blot of GFP pull-downs (PD) probed with anti-V5 from S2 cell extracts expressing V5-DCAF12, GFP and V5-DCAF12, or V5-DCAF12 and GFP-DDB1. GAPDH was used as a loading control. (J) Muscle nuclei stained for mycDDB1 and DCAF12. (K–N) Muscle surface area (MSA [K and N]), nuclear area (L), and normalized number (M) of nuclei (n ≥ 11). (O) Muscles stained for DCAF12. (P–R) Reduced Cul4 levels suppress DCAF12 OE effects on MSA (P), normalized bouton number (Q), and size (R) of nuclei (n ≥ 6). Scale bars, 20 µm (A and O), 10 µm (H and J), and 5 µm (B and C). Graphs display means ± SEM. Statistical analysis used two-tailed unpaired t test (E and K–N), Mann–Whitney test (D), or one-way ANOVA (F, G, and P–R); *, P < 0.05; **, P < 0.01; ***, P < 0.001.

