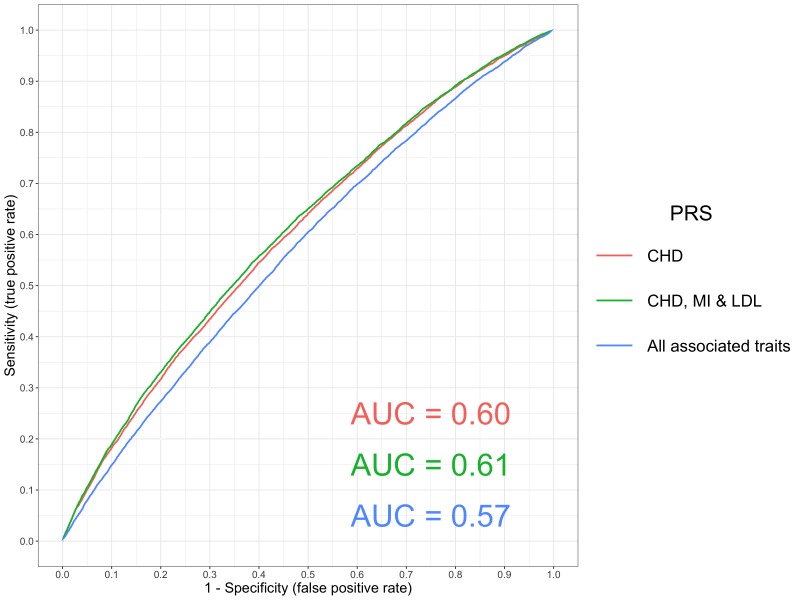
Figure 2. A receiver operator curve for ischaemic heart disease polygenic prediction.
A receiver operating characteristic (ROC) curve to compare the sensitivity and specificity of polygenic risk scores (PRS) and individuals with ischaemic heart disease (defined using ICD 10 codes ‘I25’) in the UK Biobank study. The scores evaluated were 1. Coronary Heart Disease (CHD), 2. A combined scored of CHD, Myocardial Infarction (MI) and Low Density Lipoprotein cholesterol (LDL), 3. All traits with a p-value<1×10−06 in our PRS analysis (excluding scores from GWAS overlapping with the UK Biobank sample). These were CHD, MI, LDL, Total cholesterol, Triglycerides, High Density Lipoprotein cholesterol, Years of schooling, Height and Waist Circumference. All PRS were constructed from GWAS using independent SNPs with p<5×10−05.

