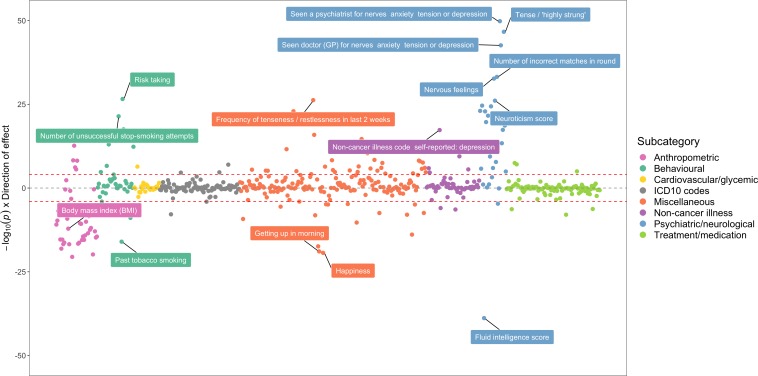
Figure 3. A bi-directional phenome-wide association plot for schizophrenia genetic liability.
Each point on this plot represents the association between the schizophrenia polygenic risk score (based on p<5×10−05) and a complex trait in the UK Biobank study. Along the y-axis are –log10 p-values for these associations multiplied by the direction of effect for their corresponding effect size. As such, traits positively associated with schizophrenia genetic liability reside above the horizontal grey line representing the null (i.e. –log10 (P) = 0), whereas negative associations are below. Points are grouped and coloured based on their corresponding complex traits’ subcategory. Horizontal red lines indicate the Bonferroni corrected threshold for the 551 tests undertaken (i.e. 0.05/551 = 9.07×10−05).

