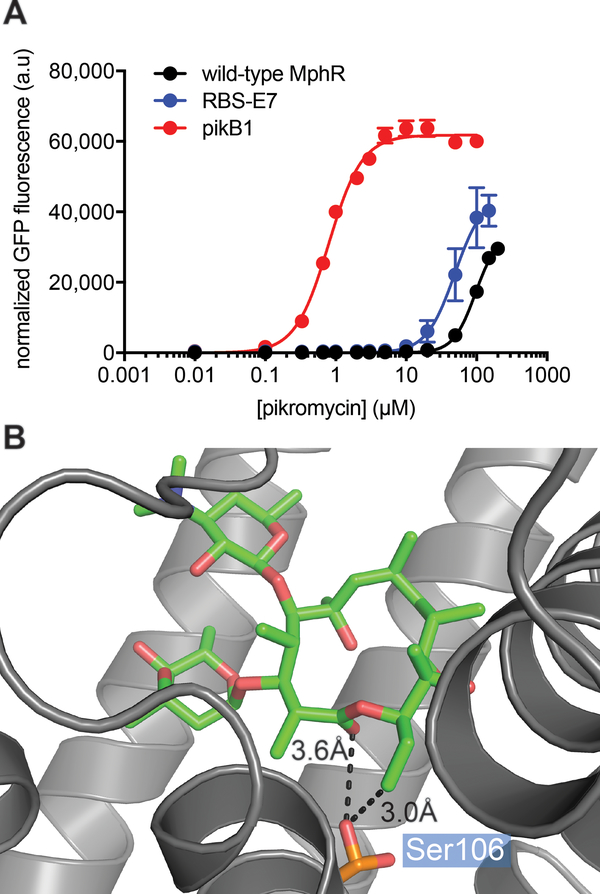
Figure 4.
Characterization of a MphR biosensor optimized towards pikromycin. (A) Dose-response analysis of wild-type MphR and PikB1 with the inducer pikromycin. Error-bars represent the standard error of the mean (n=3) and are only visible when larger than the data point symbol. (B) The crystal structure of MphR (PDB: 3FRQ) complexed with ErA (green sticks). Ser106 is shown as orange sticks.

