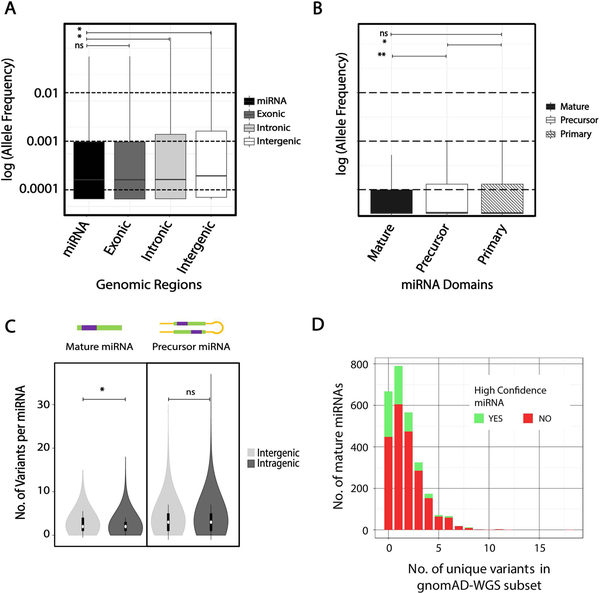
Figure 5. Patterns of miRNA variation in gnomAD WGS (n=15,496) dataset.
A. Distribution of allele frequency of all variants in log-scale across 4 different genomic regions; precursor miRNA (miRBase v21), protein-coding exonic (GENCODEv19), intronic (GENCODEv19), and intergenic (remaining fraction of the hg19 reference, slanted line fill). B. Allele frequency distribution of variants (log-scale) in mature, precursor, and primary domains of miRNAs, C. Allele frequency distribution of variants across mature and precursor miRNA domains compared between miRNAs in intragenic and intergenic regions (within RefSeq genes). D. Number of miRNAs across each bin of number of unique mature domain variants. *- Mann-Whitney adjusted p-value <0.001, ns- not significant

