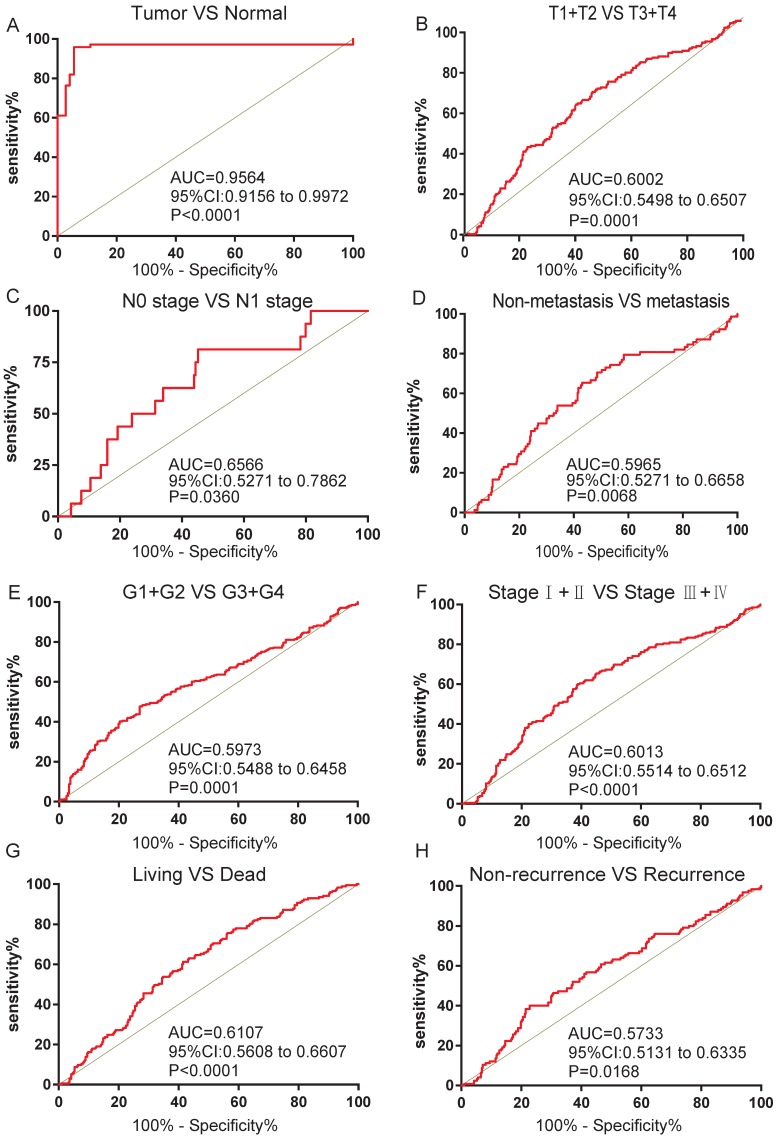
Figure 3.
FZD1 expression served as a diagnostic indicator in ccRCC patients. ROC curve showed that FZD1 could effectively distinguish ccRCC from (A) paired non-cancerous tissues, and ROC curve analysis towards the expression of FZD1 mRNA in subgroups of ccRCC patients against (B) T stage, (C) TNM stage, (D) metastasis status, (E) G stage, (F) N stage, (G) OS status and (H) recurrence status.

