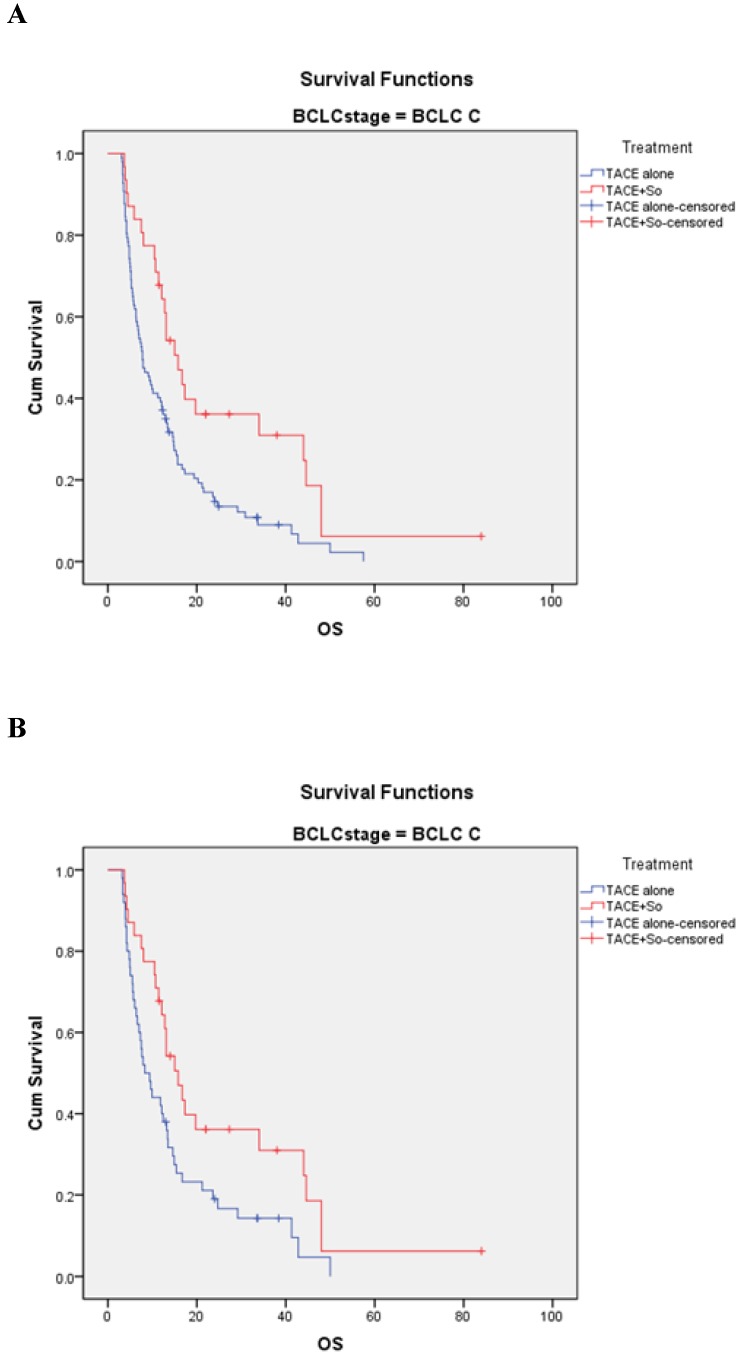
Figure 4.
Kaplan-Meier analysis of OS in BCLC-C subgroup. (A) Median OS was 15.8 ± 2.0 months in the combined treatment group compared with 7.8 ± 1.1 months in the monotherapy group in the non-matched model (P = 0.003). (B) Median OS was 15.8 ± 2.0 months in the combined treatment group compared with 8.3 ± 1.4 months in the monotherapy group in the matched model (P = 0.016).

