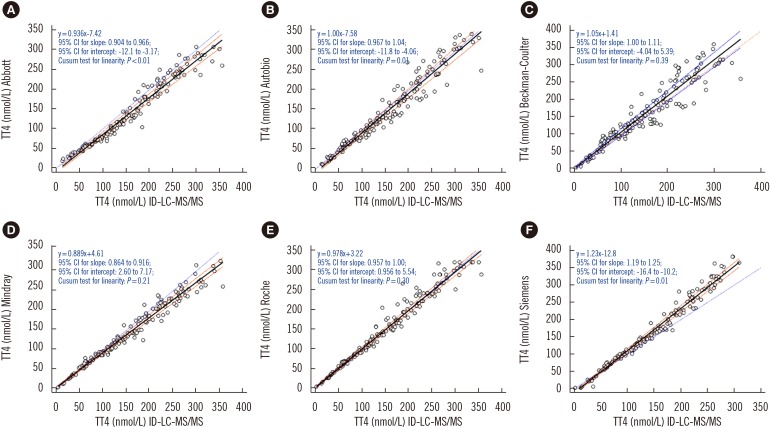
Fig. 1. Passing-Bablok regression analyses between immunoassays (A, Abbott; B, Autobio; C, Beckman-Coulter; D, Mindray; E, Roche; F, Siemens) and ID-LC-MS/MS. Solid black line: Passing-Bablok regression line, dashed brownish red lines: 95% CI for the regression line, dotted blue line: identity line (x=y).
Abbreviations: TT4, total thyroxine; ID-LC-MS/MS, isotope-diluted liquid chromatography-tandem mass spectrometry; CI, confidence interval.

