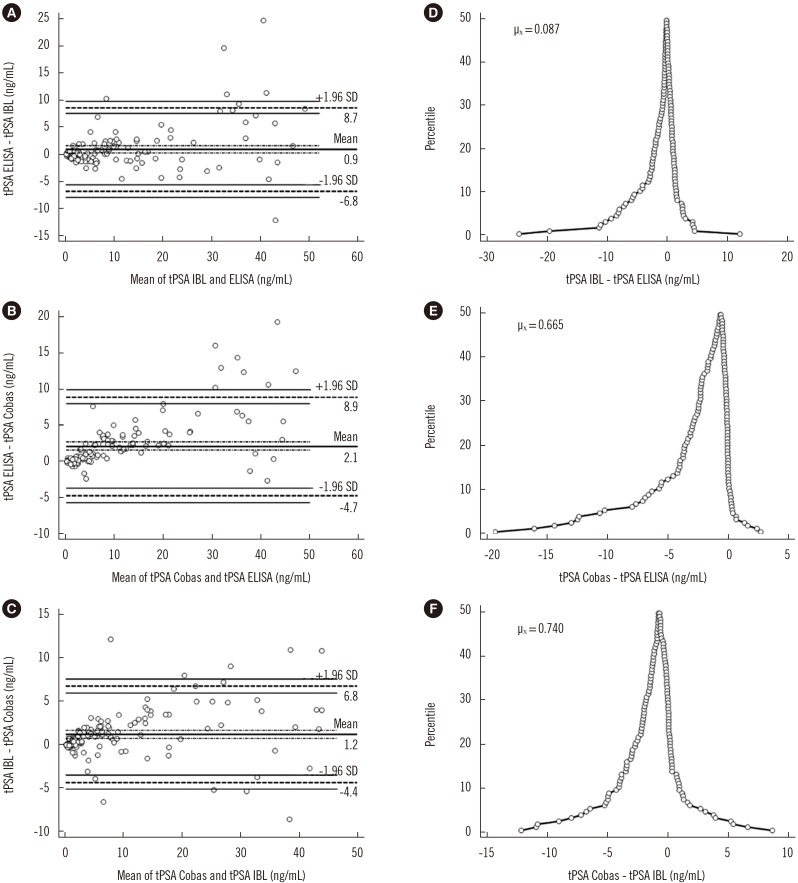
Fig. 5. The correlation between quantitative tPSA measurement assays by Bland and Altman algorithm (A–C) and the percentile distribution of differences (D–F). The dashed line indicates the limit of agreement line; the thin solid lines indicate the confidence interval lines; the thick solid line indicates the average difference line; the dashed dotted lines indicate the confidence interval of the average differences line.
Abbreviations: PSA, prostate specific antigen; tPSA ELISA, total serum PSA concentration determined by IgY-based ELISA; tPSA IBL, total serum PSA concentration determined with the PSA total ELISA (IBL International, Hamburg, Germany); tPSA Cobas, total serum PSA concentration determined with Cobas 6000 (Roche Diagnostics, Warszawa, Poland); µX, mean difference.

