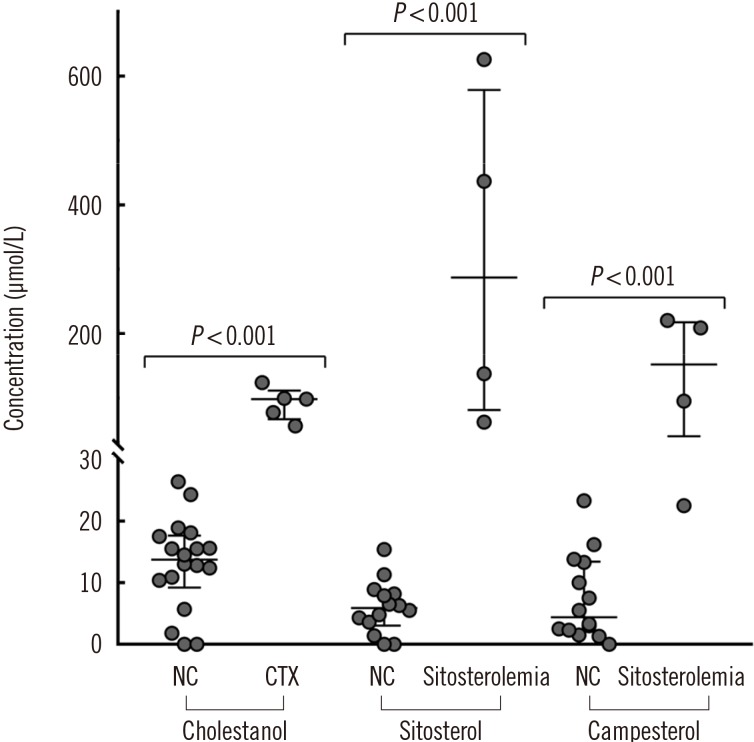
Fig. 1. Comparison of phytosterol levels between NCs (N=18) and patients with CTX (N=5) and sitosterolemia (N=4). The outer horizontal lines at both ends depict the upper and lower quartile values, and the middle horizontal line depicts the median. P value was calculated using the Mann–Whitney U test.
Abbreviations: NC, normal control; CTX, cerebrotendinous xanthomatosis.

