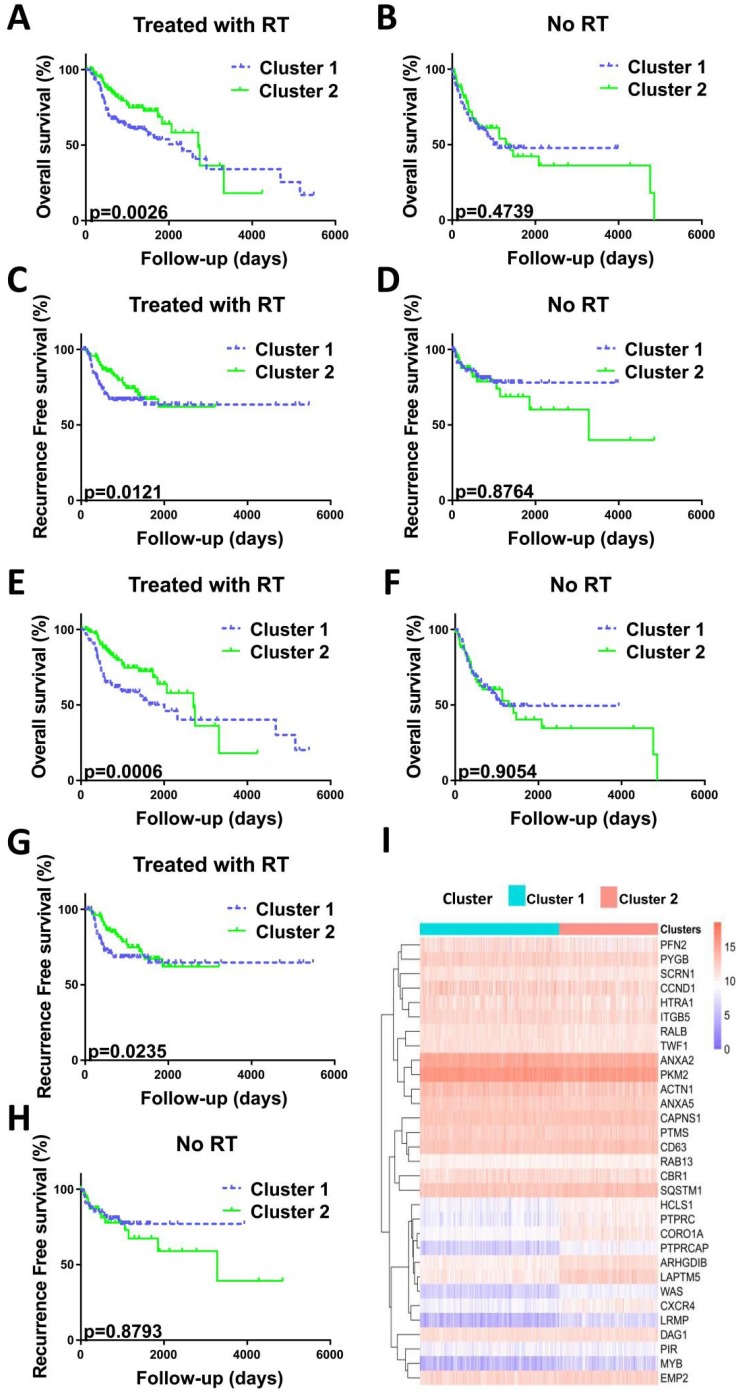
Figure 1.
Validation of radiosensitivity gene signature in HNCs. Before PSM analysis, OS curve (A) and RFS curve (C) indicated the prolonged survival of patients with radiotherapy in cluster 2. P=0.0026 and P=0.0121, respectively. OS curve (B) and RFS curve (D) indicated no correlation between clusters and survival in patients not treated with radiotherapy. P=0.4739 and P=0.8764, respectively. After PSM analysis, OS curve (E) and RFS curve (G) indicated the prolonged survival of patients with radiotherapy in cluster 2. P=0.0006 and P=0.0235, respectively. OS curve (F) and RFS curve (H) indicated no correlation between clusters and survival in patients not treated with radiotherapy. P=0.9054 and P=0.8793, respectively. P-values calculated using the Gehan-Breslow-Wilcoxon test. (I) Heatmap illustrating the relationship between the radiosensitivity gene signature of 31 genes and two groups before PSM analysis. Columns represent samples and radiosensitivity, and rows indicate genes expressed. Legend: blue, low expression; pink, high expression; green, cluster 1 group; pink, cluster 2 group.

