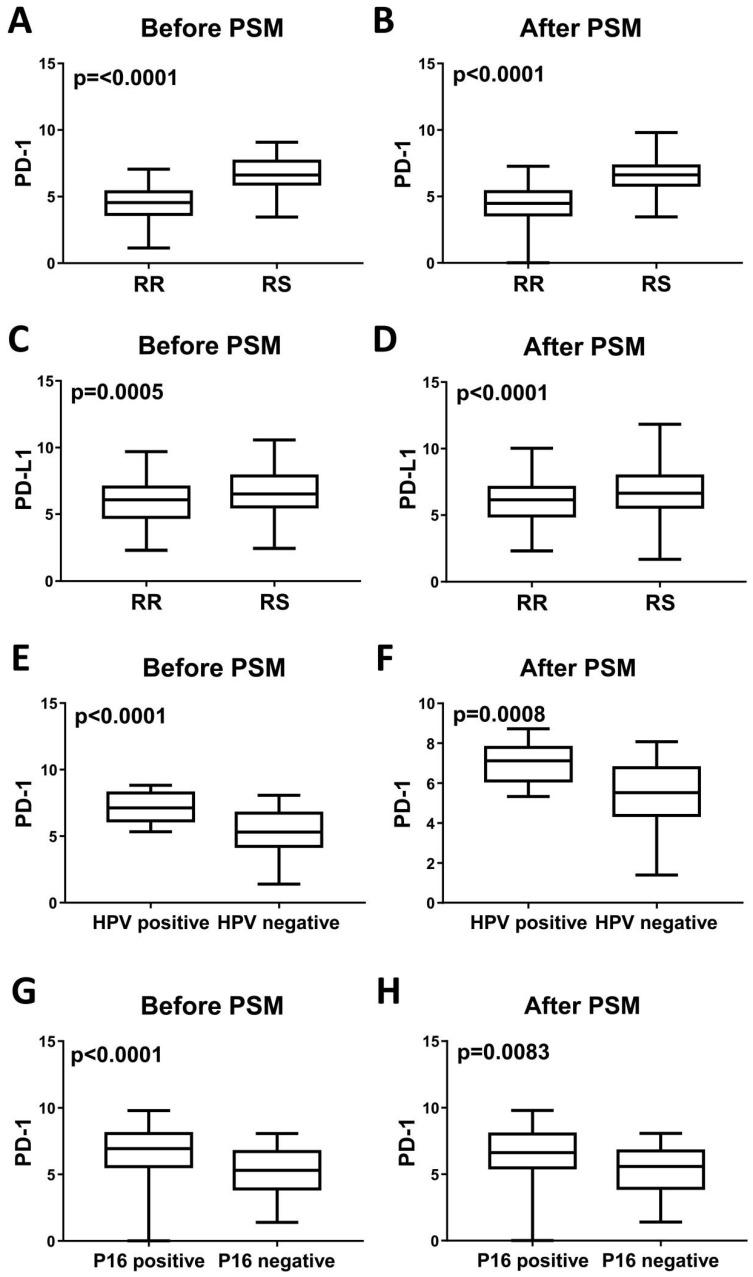
Figure 2.
Levels of PD-1 mRNA expression and PD-L1 mRNA expression in head and neck tumors before and after PSM analysis. PD-1 mRNA is upregulated in RS tumors (A), HPV-positive tumors (E) and P16-positive tumors (G) before PSM analysis. All P<0.0001. After PSM analysis, PD-1 mRNA expression is also upregulated in RS tumors (B), HPV-positive tumors (F) and P16-positive tumors (H). P<0.0001, P=0.0008 and P=0.0083, respectively. PD-L1 mRNA expression is upregulated in RS tumors before (C) and after (D) PSM analysis. P=0.0005 and P<0.0001, respectively.

