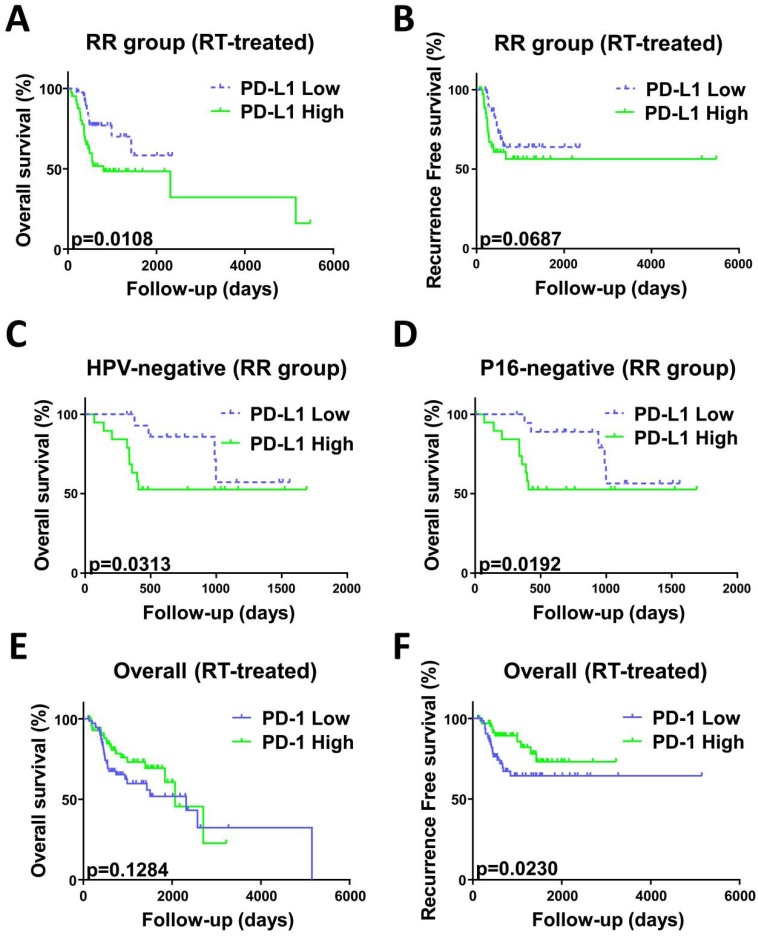
Figure 4.
Kaplan-Meier curves analysis stratified by radiosensitivity. OS curve (A) and RFS curve (B) indicated worse prognosis of patients with high PD-L1 mRNA expression in the RR group compared with low PD-L1 mRNA expression. P=0.0108 and 0.0687, respectively. OS curves indicated worse prognosis of HPV (C) or p16 (D) negative status patients with high PD-L1 mRNA expression in the RR group compared with low PD-L1 mRNA expression. P=0.0313 and 0.0192, respectively. (E) OS curves indicated that the PD-1 mRNA level does not correlate with overall survival in all patients(n=289). P=0.1284. (F) RFS curves indicated that patients with low PD-1 mRNA levels recurred earlier than those with high PD-1 mRNA levels. P=0.0230. P values calculated by Gehan-Breslow-Wilcoxon test.

