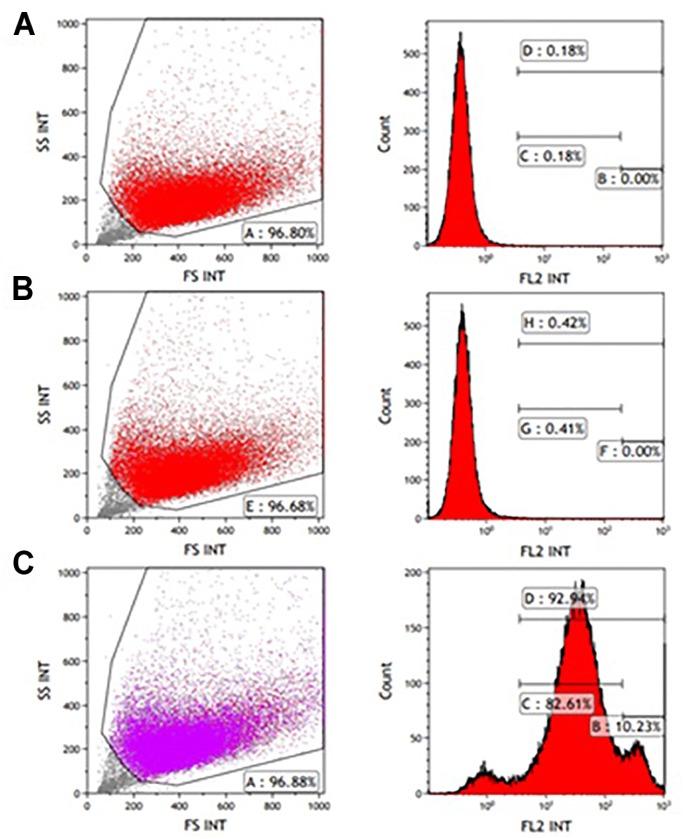
FIGURE 1.
FACS analysis of CD56 expression in P1 myogenic cells. CD56-positive cells were resolved using light scattering (FS, forward scatter; SS, side scatter). (A) Incubation without antibodies was used as a baseline. (B) Staining for non-specific mouse immunoglobulin G (IgG) isotype fluorescence was used as a control. (C) 92.94% of the isolated cells express the CD56 surface marker related to human myogenic cells according to the peak area shown following staining with anti-human CD56-Phycoerythrin (PE) antibody.

