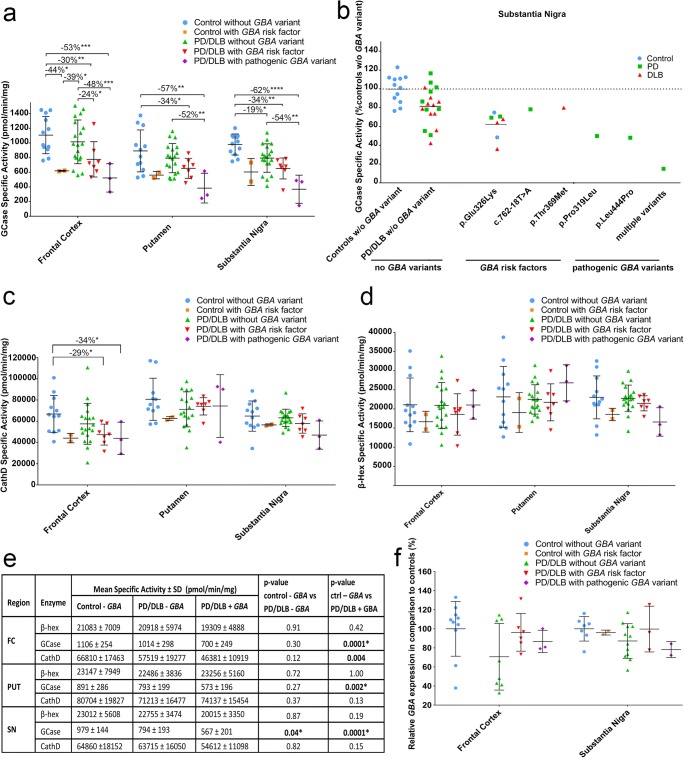
Fig. 4.
Population stratification based on GBA genotype. Specific enzymatic activities for GCase (a), β-Hex (c), and CathD (d) for non-demented controls without GBA variants (blue) and with GBA risk factors (orange), for PD and DLB patients without GBA variants (green), with GBA risk factors (red), and with pathogenic GBA variants (purple). b Measured GCase activities in the SN per GBA variant for controls (blue), PD patients (green), and DLB patients (red). d Overview of mean enzyme activities ± standard deviations in different GBA genetic subgroups. p values indicate the between-group difference per brain region. e GBA mRNA expression levels for controls, PD and DLB patients without GBA variants, with GBA risk factors, and pathogenic GBA variants. *p < 0.05; **p < 0.01; ***p < 0.001; ****p < 0.0001

