Fig. 1.
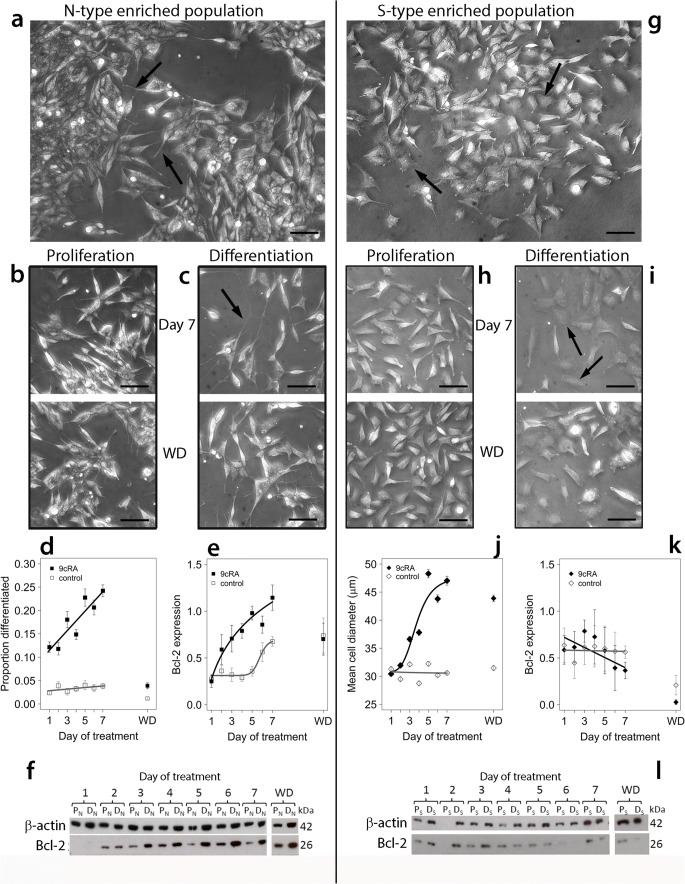
Differentiation of N-type-enriched and S-type-enriched populations. N-type (a) or S-type enriched populations (g) were treated for up to 7 days with 1 μM 9cRA to induce differentiation (c, i) or an equivalent volume of EtOH for proliferating controls (b, h) after which treatment was withdrawn and cells were grown for a further 5 days (WD). Scale bars (phase-contrast images) represent 50 μm. Cells proliferating within N-type-enriched populations had short, neurite-like processes (a, arrows) and often grew in aggregates. Differentiating N-type-enriched populations contained cells with elongated neurites (c, day 7), whereas after washout cultures they were similar to proliferating cultures (b, c, WD). Within proliferating S-type-enriched populations, cells had abundant cytoplasm and a flattened morphology (g, arrows). Cells within differentiating S-type populations frequently exhibited a flattened morphology with spread cell margins (i, day 7; arrows), retained after washout (i, WD). Over the treatment time course, there was a significant increase in proportion of differentiated cells in N-type-enriched populations treated with 9cRA (d, 488–1192 cells per time point) compared to proliferating populations (d, 398–1084 cells per time point; linear model, effect of time F1,10 = 24.3, P < 0.001; differentiation F1,10 = 247.6, P < 0.0001; interaction F1,10 = 17.6, P < 0.002). After washout (WD), the proportion of differentiated cells returned to baseline (d). For cells in S-enriched populations, there was a significant effect of 9cRA (j, 399–543 cells per time point) in increasing cell diameter compared to proliferating cells (j, 315–678 cells per time point; differentiation effect, F4,7171 = 468.8, P < 0.001) which remained after washout. In N-type-enriched cultures, Bcl-2 expression (normalised to β-actin) increased after treatment with 9cRA (e, example blot in f), but increased to a lesser extent and only after 6–7 days in proliferating cultures (e; differentiation effect, linear mixed-effect analysis: P < 0.001). After washout, Bcl-2 expression was similar in differentiating and proliferating cultures (e; f: example blot of a single experiment [filter was torn at day 5 PN track during processing and image re-joined]). For S-type-enriched populations, there was a small but significant difference in Bcl-2 expression between proliferating and differentiating populations (k; example blot in l) over the treatment time course (effect of differentiation: P = 0.05), and a significant difference between proliferating and differentiating cells over time (interaction: P = 0.004). All error bars are ± SEM

