Fig. 2.
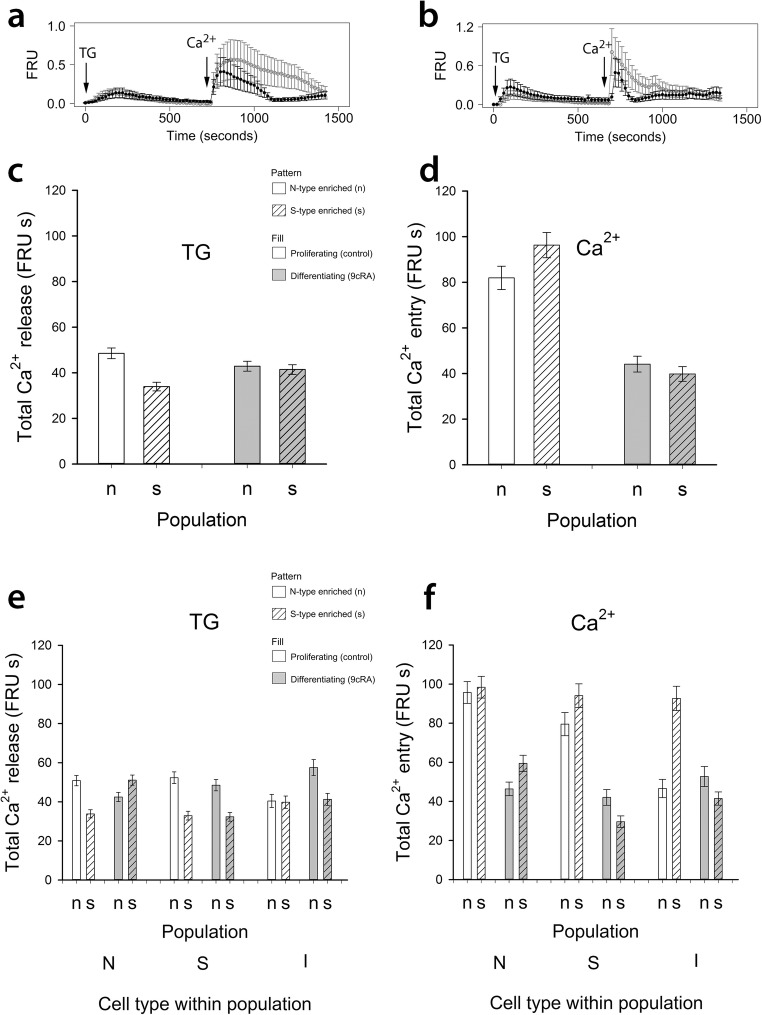
Uncoupling SOCE from ER Ca2+ store release in response to differentiation. In cells loaded with fura-2 and in Ca2+-free buffer, changes in fluorescence ratio units (FRU) reflect changes in [Ca2+]i after adding thapsigargin (TG, 200 nM) to induce Ca2+ store release and subsequent re-addition of extracellular Ca2+ (CaCl2, 2 mM) to induce SOCE. Example traces from five cells combined (mean and SEM) are shown from N-type-enriched populations (‘n’) in a, and from S-type-enriched populations (‘s’) in b. Single-cell analysis of SOCE pathway activity (AUC; units FRU by time in seconds, abbreviated to FRU s) in ‘n’ and ‘s’ populations treated for 7 days with 1 μM 9cRA to induce differentiation or an equivalent volume of EtOH to maintain proliferation are shown in c–f (sample sizes in Table 2). With respect to Ca2+ release for cells within ‘n’ and ‘s’ populations overall (c), there was no significant effect of differentiation (P = 0.3) but population and interaction effects showed a significant decrease of Ca2+ release in cells in differentiating ‘n’ populations (P < 0.001) whereas Ca2+ release was increased in ‘s’ populations (P < 0.001). Comparisons of N-type cells within and between populations (e) showed that all main effects and interactions were significant: there was a significant decrease of Ca2+ release in N-type cells within ‘n’ populations but a significant increase of Ca2+ release in N-type cells within ‘s’ populations (P < 0.001). For S-type cells, there was no significant effect of differentiation (P = 0.16), or interaction, but a significant difference between populations (P < 0.001). All effects for I-type cells (population, differentiation) were significant (P < 0.001 for differentiation; P < 0.01 for population and interactions), but from the interaction effects, there was no difference in Ca2+ release as a result of differentiation of I-type cells within ‘s’ populations (P > 0.6) in contrast to the increased Ca2+ release after differentiation of I-type cells within ‘n’ populations (P < 0.001). For SOCE data for all cell types within populations (d), there was a significant effect of differentiation on reducing SOCE in both populations (P < 0.001), and this was also the case for N-type and S-type cells separately (f), although S-type cells had a bigger reduction of SOCE in ‘s’ populations (P < 0.001). For I-type cells, SOCE was significantly reduced by differentiation within ‘s’ populations (P < 0.001), a consequence of the high SOCE response of I-type cells in proliferating ‘s’ populations compared to proliferating ‘n’ populations. All error bars are ± SEM

