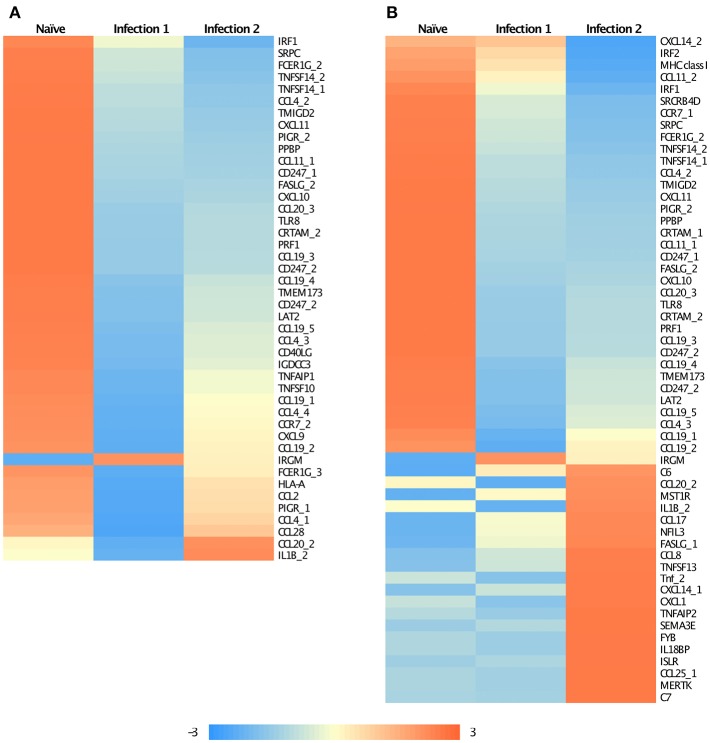
Figure 2.
Heatmap of the standardized FPKM gene expression, showing relative levels of abundance of differentially regulated immune related transcripts between (A) Naïve and animals during the first infection and (B) Naïve and animals during the second infection. Numbers following an underscore represent putative duplicated genes.

