
Figure 3.
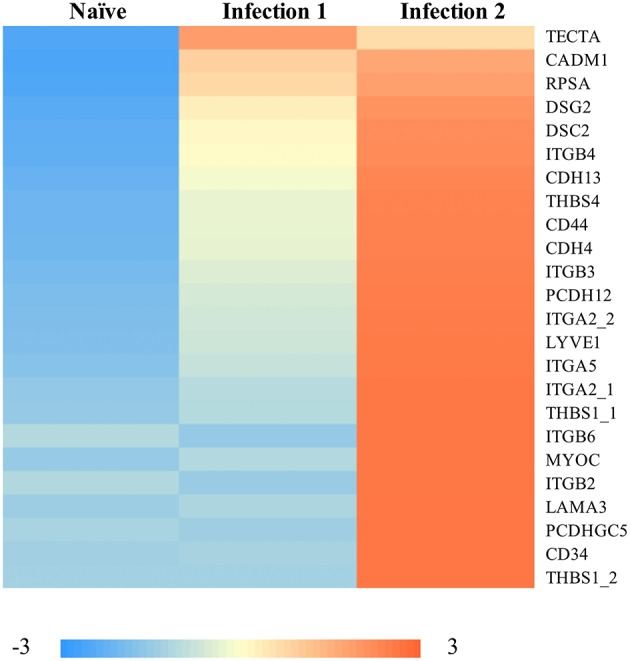
Heatmap of the standardized FPKM gene expression, showing relative levels of abundance of differentially regulated transcripts with functional properties in “cell-adhesion” between naïve and animals during the 2nd infection. Numbers following an underscore represent putative duplicated genes.