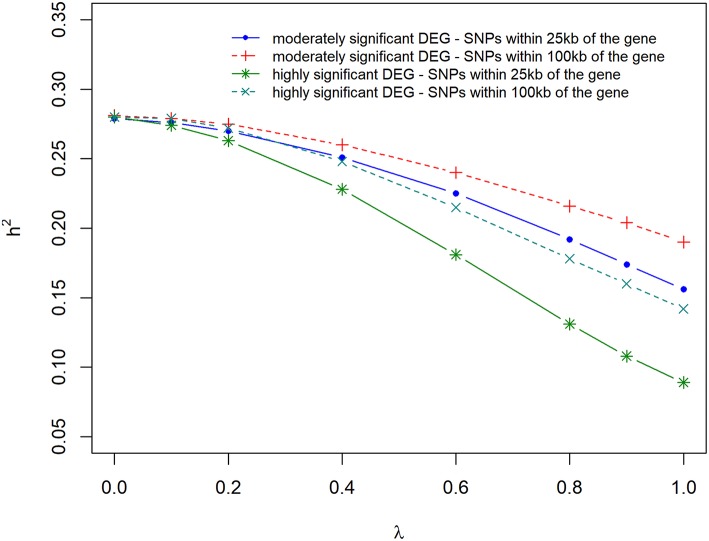
Figure 5.
Estimate of heritability for different λ (blending of two genomic relationship matrices) values. The two genomic relationship matrices were generated for SNPs that were either within significant differentially expressed (DE) genes in gene expression analysis or not. Markers within significant DE genes were also weighted with the log2ΔF of that gene.

