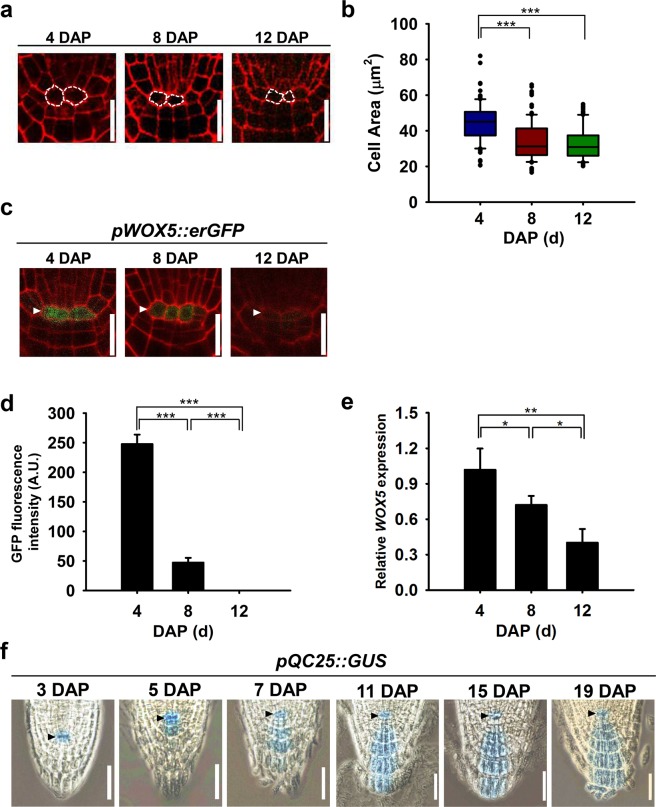
Figure 1.
Temporal changes in size of quiescent cell (QC) cells and expression of QC cell-specific markers. (a) Representative confocal images of PI-stained stained root apical meristem (RAM) at 4 (left), 8 (middle), and 12 DAP (right). The QC cells are outlined with dashed lines. Scale bars, 20 μm. (b) Box and whisker plots showing the distribution of QC cell area at 4, 8, and 12 DAP (n = 100 for each time points). Boxes represent interquartile range while whiskers and dots represent total range. Statistical analysis was performed using two-tailed Student’s t-test (***p < 0.001). (c) Representative confocal images of PI-stained primary root tips expressing pWOX5::erGFP at 4, 8, and 12 DAP. Scale bar, 20 μm. (d) Quantification of pWOX5::erGFP fluorescence from (c) via image analysis of confocal sections. Data represent means ± SD (n = 15) from three independent trials. Statistical analysis was performed using two-tailed Student’s t-test (***p < 0.001). (e) Relative expression levels of WOX5 at 4, 8, and 12 DAP. The WOX5 transcript level was analyzed by RT-qPCR, normalized to ACT2, and shown as relative values to the level at 4 DAP. Data represent means ± SD (n = 3). Statistical analysis was performed using two-tailed Student’s t-test (*p < 0.05; **p < 0.005). (f) GUS expression driven by the QC25 promoter in the primary RAMs at the number of days indicated. White and black arrowheads indicate the QC cells in (c,f), respectively. DAP, days after planting; Scale bar, 50 μm.

