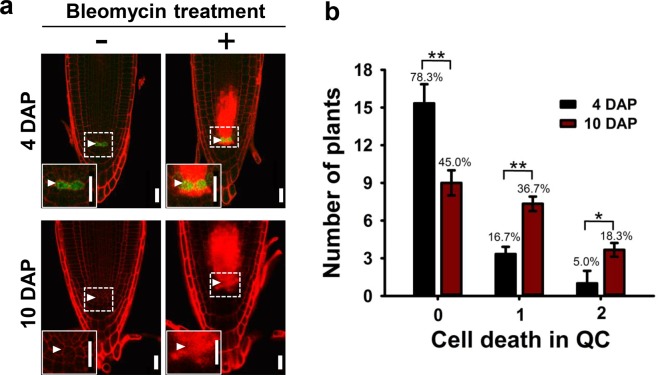
Figure 2.
Comparison of the genotoxic effects of bleomycin on the QC cells in seedlings at 4 and 10 DAP. (a) Representative confocal images of the pWOX5::erGFP primary roots with (right column) or without (left column) 1 μg/ml bleomycin treatment for 1 day at 4 DAP (upper row) and 10 DAP (lower row). PI-stained cell walls indicate living cells, whereas intense red PI staining inside cells indicates dead cells. The insets at the bottom left show close-ups of the QC cells. White arrowheads indicate the QC cells. DAP, days after planting; Scale bar, 20 μm. (b) The number of plants harboring 0, 1, and 2 dead QC cells after bleomycin treatment and the respective percentages. Data represent means ± SD (n = 20) from three independent trials. Statistical analysis was performed using two-tailed Student’s t-test (*p < 0.05; **p < 0.01).

