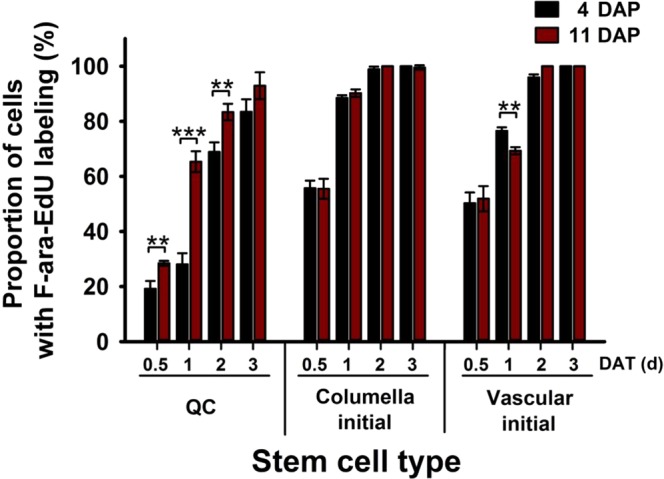
Figure 4.

Comparison of cell division rates of various stem cell types in seedlings at 4 and 11 DAP. The graph shows the cell division rates in the QC (left), columella initial (middle), and vascular initial (right) cells. Entry into the S-phase of the cell cycle was monitored in the RAM of primary roots of 4- (black bars) and 11-DAP (red bars) seedlings at 0.5, 1, 2, and 3 DAT from 1/2 MS media to F-ara-EdU-supplemented media. Cells entering the S-phase were determined by red fluorescence of Alexa 555 dye conjugated with F-ara-EdU, which is incorporated into newly synthesized DNA during cell division. Data represent means ± SD (n = 15) from three independent trials. Statistical analysis was performed using two-tailed Student’s t-test (**p < 0.01; ***p < 0.001). DAP, days after planting; DAT, days after transfer.
