Figure 5.
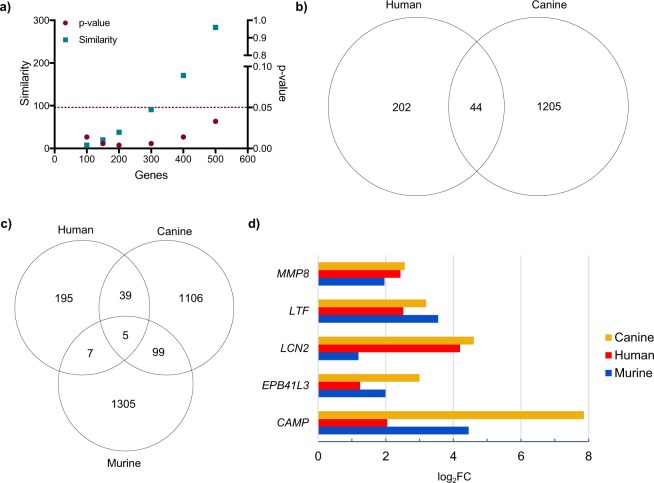
Cross-species comparisons of PMN-MDSCs highlight common transcriptomic signatures across three mammalian taxa. (a) Similarity score (square) and p-value (circle) are graphed using the top 100–500 canine and human PMN-MDSC differentially expressed genes input into the ‘OrderedList’ R program. Dashed line indicates p = 0.05, and up to the top 500 genes are statistically similar in both species. (b,c) Venn diagram comparing upregulated genes in canine and human (b) and canine, human, and murine (c) PMN-MDSCs relative to C PMNs. Only those genes with a FC ≥ 2 and FDR ≤ 0.05 were included in this analysis. (d) Bar chart comparing the fold change of the five conserved genes across the three species.

