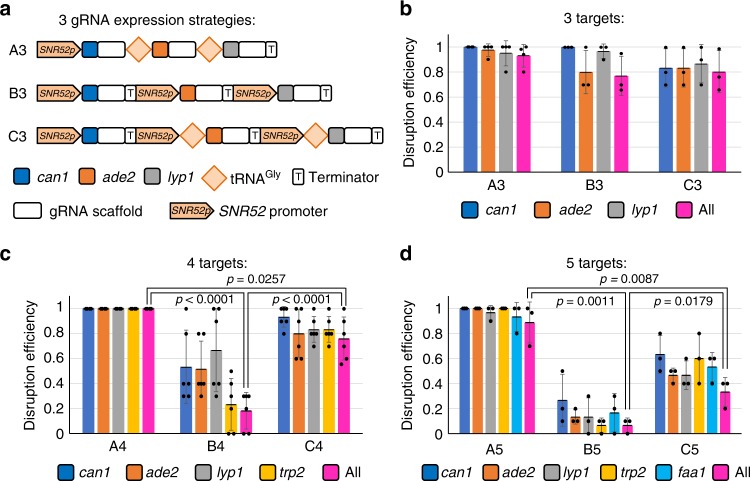
Fig. 2.
Evaluations of different guide RNA (gRNA) expression systems for 3–5 genes. a Graphic representation of the three different gRNA expression systems for three-gene disruptions. The A3, B3, and C3 represent three gRNAs expressed from mode A, B, and C, respectively. b–d Results of disruption efficiencies of 3–5 genes. The data of bar charts represent mean averages of each gene or overall disruption efficiencies. Each black dot represents the gene disruption efficiency of 10 colonies from each biological replicate, and the error bars indicate the standard deviations of all (n ≥ 3) biological replicates. The statistical analyses were performed using unpaired t Test. Source data are provided as a Source Data file

