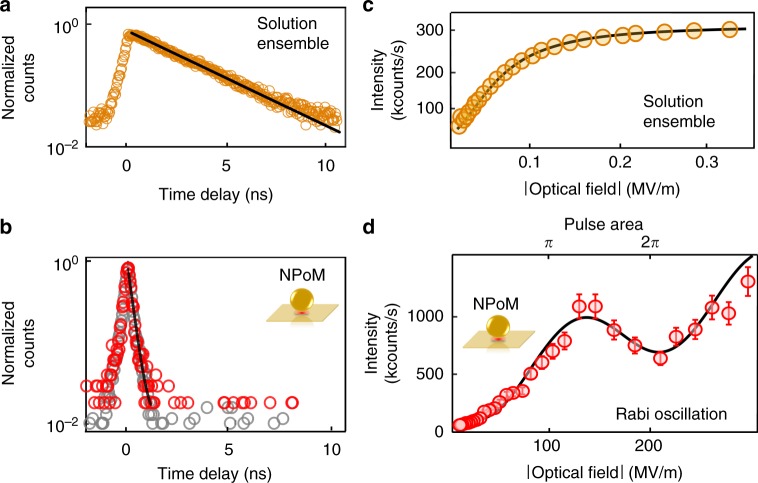
Fig. 2.
Time-resolved and power-dependent measurements. a, b Time-resolved emission under 120 fs pulsed excitation of a 10 μM concentration ensemble of Atto647 in solution (orange circles) and b single Atto647 in NPoM (red circles), together with instrument response (gray circles). Lines are single exponential fits. c, d Measured intensity vs optical field on sample for ensemble Atto647 in water and single molecules in NPoM, respectively. Curves are fits to the experimental data, described in the text. Error bars are the fluctuations of the measured counts on the detector

