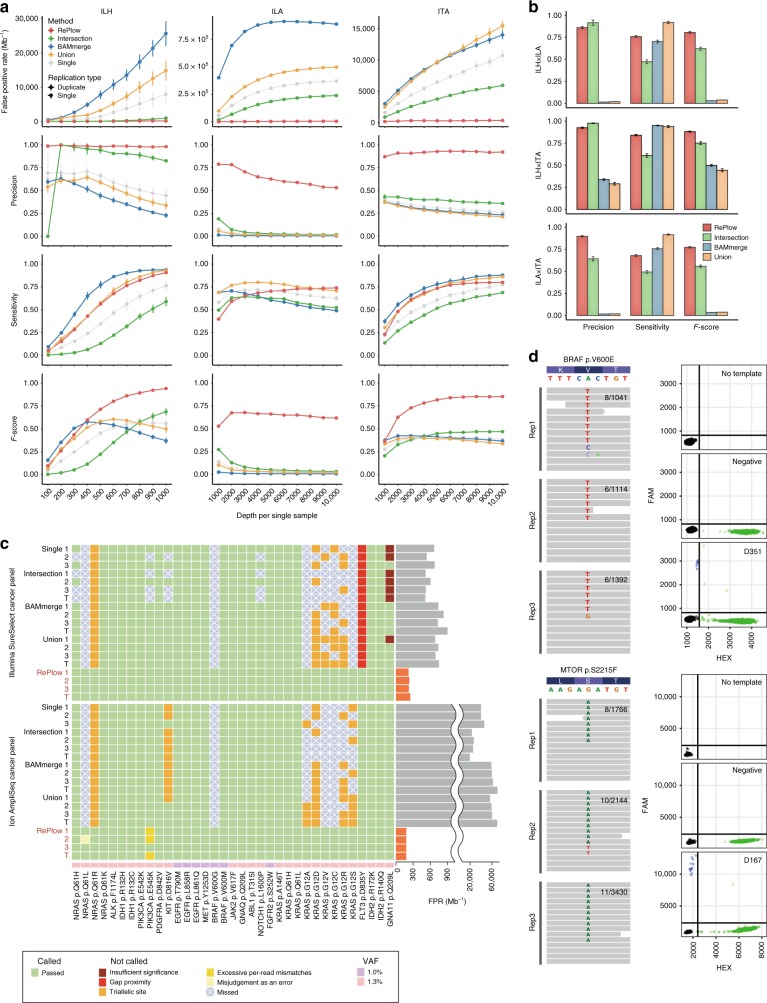
Fig. 4.
Comparative performances of RePlow and the primitive approaches. a Performance assessment with the library replicates of test-base data. FPR, precision, sensitivity, and F-score were measured for sample B (1% VAF). All three combinations of duplicates were tested, and their average performances were reported with 95% confidence intervals (typically smaller than marks). b Performance assessment with the combination of replicates in multiplatforms. All pairs of library replicates between different platforms were tested with test-base data of sample B. Only the data sets with the highest depth of each platform were used for the combination (1000× for ILH and 10,000× for ILA and ITA). Error bars, 95% confidence intervals. c Independent assessment with a reference material sequenced by two widely-used cancer panels. Detection of 35 true cancer hotspot SNVs (1–1.3% VAF) were tested for all combinations of library triplicates (X1X2, X2X3, X1X3, and X1X2X3 are denoted as 1, 2, 3, and T, respectively). Green shading means a correct detection, and other colors represent the reason for the rejection or no detection (with X marks). FPRs of RePlow are highlighted in orange to emphasize their reductions therein, compared to other primitive approaches. d Experimental validation of rescued low-level mutations from the samples negative for pathogenic mutations in previous analysis. Observed allele counts are described in each replicate (left). Droplet digital PCR results for no DNA template (No template), DNA from healthy controls (negative), and disease samples are shown together for each site (right). Green and blue dots represent wild type- and mutant-specific signals, respectively. Source data for a, b are provided as a Source Data file

