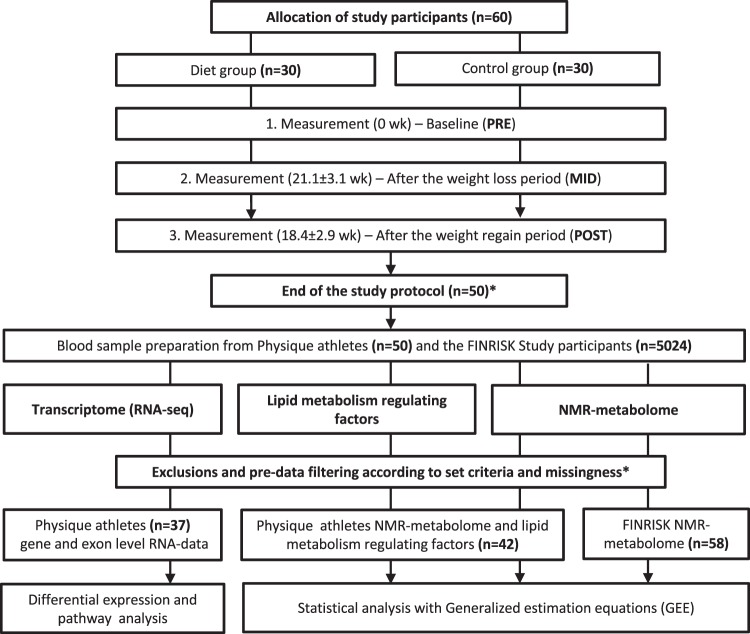
Figure 1.
Study design and workflow. Flowchart illustrating the study protocol. The weight loss and regain period of the diet group are depicted in the upper section; the omics analysis protocol is depicted in the lower section. *The study began with 60 participants; 10 failed to complete the study regimen, one control did not arrive for baseline testing (PRE), and three dieters and six controls were excluded either because the duration of their weight regain period was shorter than the other participants, or because they failed to completely follow the instructions. Additional participants that lacked complete dietary records (n = 8) were excluded from the omics study due to the high cost of large-scale dataset quantification. Furthermore, sample size varied slightly between different downstream analyses due to incompleteness of omics or phenotype data.

