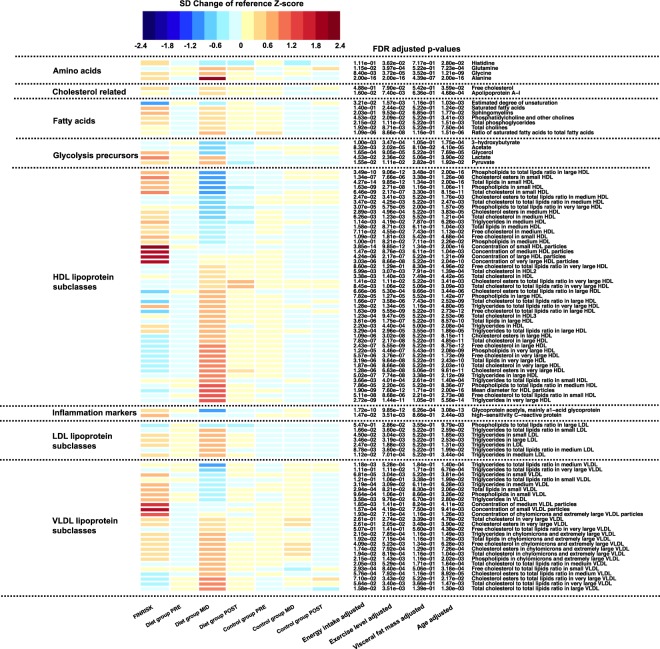
Figure 2.
Heatmap of significant metabolite profile changes. Metabolite values and color key are represented as standard deviation (SD) change from reference Z-score. Calculated baseline Z-score values (PRE) from both diet and control group were pooled together and set as the reference level to which each individual group/timepoint-level was compared. FINRISK represents a subsample of age- and BMI-matched individuals from the general population (n = 58). On the heatmap, blue indicates decrease and red indicates increase in metabolite level compared to the calculated reference value. Multiple testing adjusted P values (false discovery rate, FDR) of the diet group analysis after weight loss (PRE-MID) are indicated in front of each metabolite name. Unadjusted basic model was defined as follows: metabolite ~ time + age. Factors known to contribute to metabolite levels were added as additional covariates to the basic model to determine their effect on observed modulation of metabolome profile. Energy intake, total exercise level, and visceral fat mass were accounted for in the model separately and are shown in the figure.

